11.5 Streams and Stream Flow
Steve Earle
A stream is a body of flowing surface water of any size, ranging from a tiny trickle to a mighty river. The area from which the water flows to form a stream is its drainage basin. Some of the precipitation (rain or snow) that falls within a drainage basin is returned to the atmosphere via evaporation or transpiration. The rest either flows across the surface and into a stream, or infiltrates to become groundwater and then slowly flows towards a stream (although it is possible that some of that groundwater will cross into an adjacent drainage basin via groundwater flow). An example of a drainage basin is shown in Figure 11.5.1.
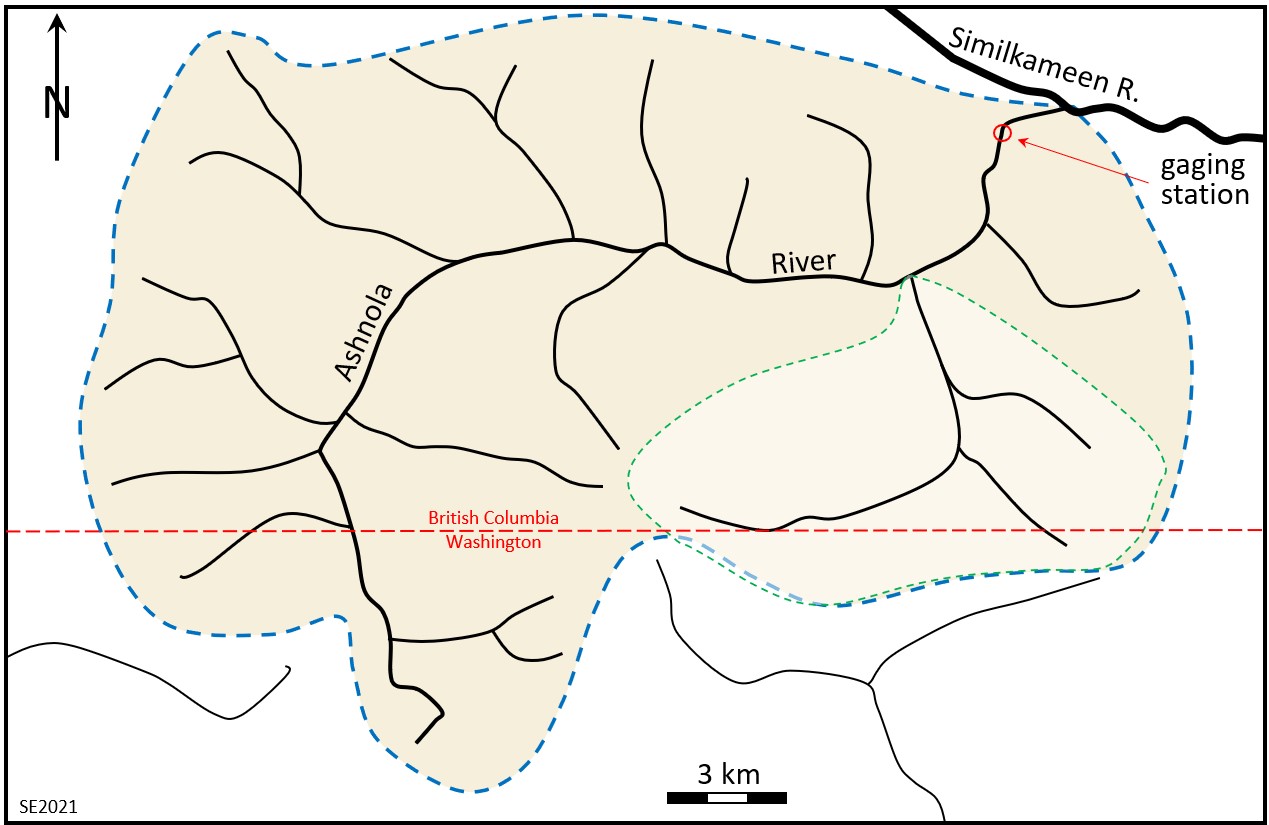
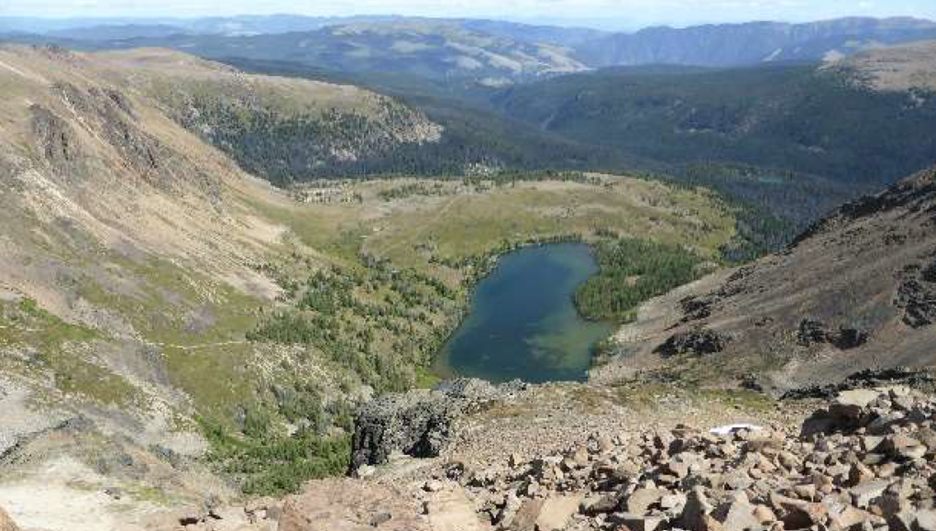
The hydrograph of Figure 11.5.3 is based on data from the marked gaging station. The Ashnola River occupies a drainage basin of approximately 1000 km2 within a glaciated alpine region of southern British Columbia and northern Washington. There are numerous peaks above 2500 m within the basin (Figure 11.5.2).
As shown in Figures 11.5.2 and 11.5.3, the upper and lower parts of the Ashnola River have quite steep gradients (in the order of 50 m/km, more in some areas) while the middle part and the part within the valley of the Similkameen River, are relatively flat (6 m/km, or less). The shape of the valley has been controlled first by tectonic uplift (related to plate convergence), then by pre-glacial stream erosion and mass wasting, then by several episodes of glacial erosion, and finally by post-glacial stream erosion and more mass wasting. The lowest elevation of the Ashnola River is 440 metres at the Similkameen River, and that is its base level. The Ashnola River cannot erode below that level unless the Similkameen River erodes deeper into its flood plain (the area that is inundated during a flood).

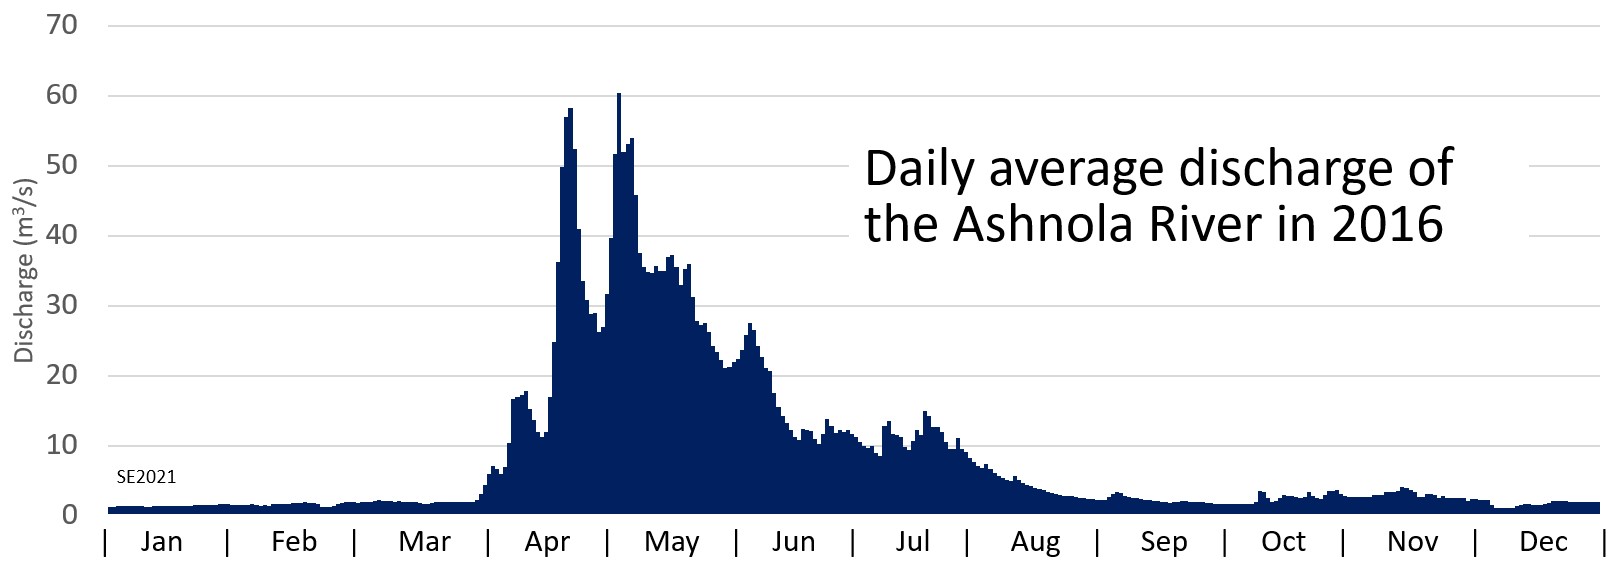
Rivers represent excellent sources of water, but it is critical to understand their flow characteristics in order to be able to manage the supply against the demand. Discharge from a stream is typically displayed in a hydrograph, where the stream flow rate is plotted on the y – axis and the date is plotted on the x axis. The flow rate can be from single measurements at specific intervals (e.g., hourly), or can be averaged over daily, weekly or even monthly intervals. Hydrographs reflect the timing of the input of rainfall to a drainage basin, and the timing of the melting of snow and glacial ice.
A hydrograph of daily average discharge levels (flow volume) for the Ashnola River is shown on Figure 11.5.4. As is typical for a stream in a relatively dry climate with cold winters, the hydrograph is dominated by spring and summer snow melt. The discharge ranges from 1 to 3 m3/s in the fall and winter months when much of the drainage basin is frozen and almost all of the precipitation is falling as snow, to over 50 m3/s in the spring, when the snow is melting rapidly and there is some rainfall. The snow-melt discharge decreases gradually from May through August, with a few minor peaks that are likely related to summer rains.
The Englishman River on Vancouver Island is situated in a warm and wet climate, where most precipitation comes as rain in the autumn and winter and the summers are dry. There is snow accumulation in the upper parts of the drainage basin but most of the area is below 400 m, and very little snow lasts beyond April. The hydrograph (Figure 11.5.5) shows consistently low flows in the summer and strong autumn and winter peaks related to both steady winter rain and to specific rainstorm events.
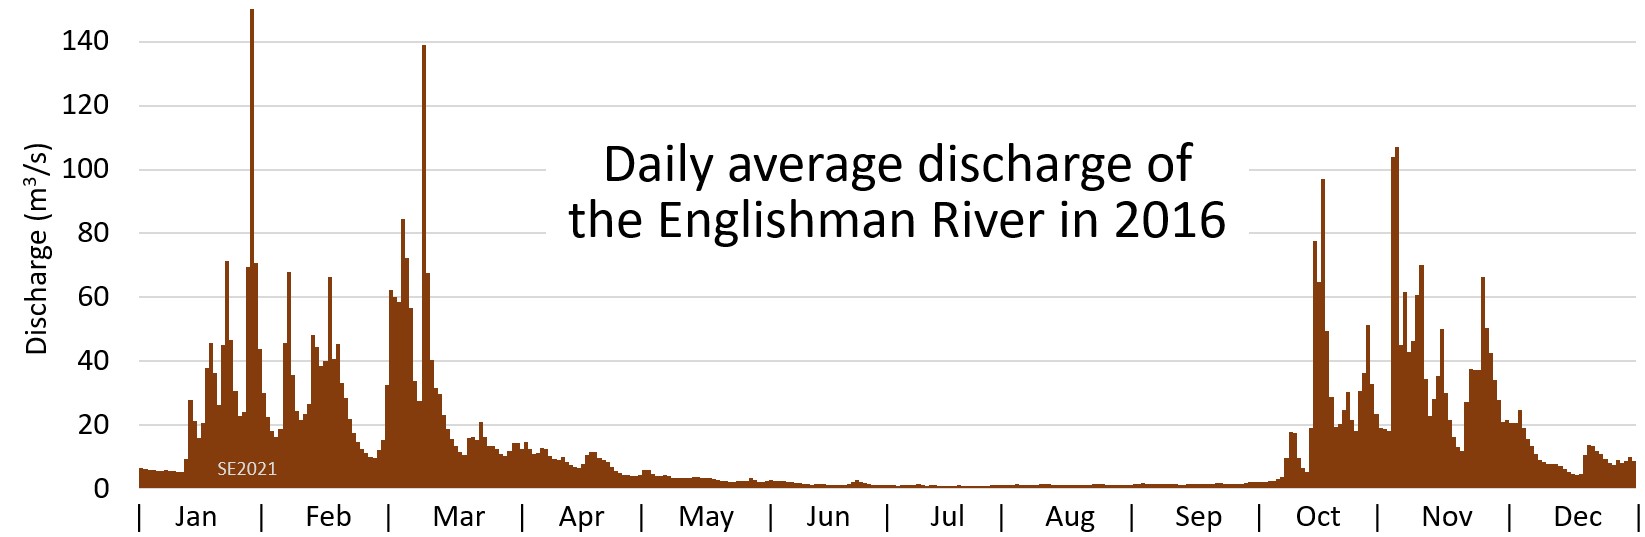
The two rivers above both demonstrate periods of the year with ample river flow, and periods with low flow. If these rivers were to be used as water supply, the periods of low flow could likely only sustain limited extraction of water before unacceptable stress was put on the ecosystem.
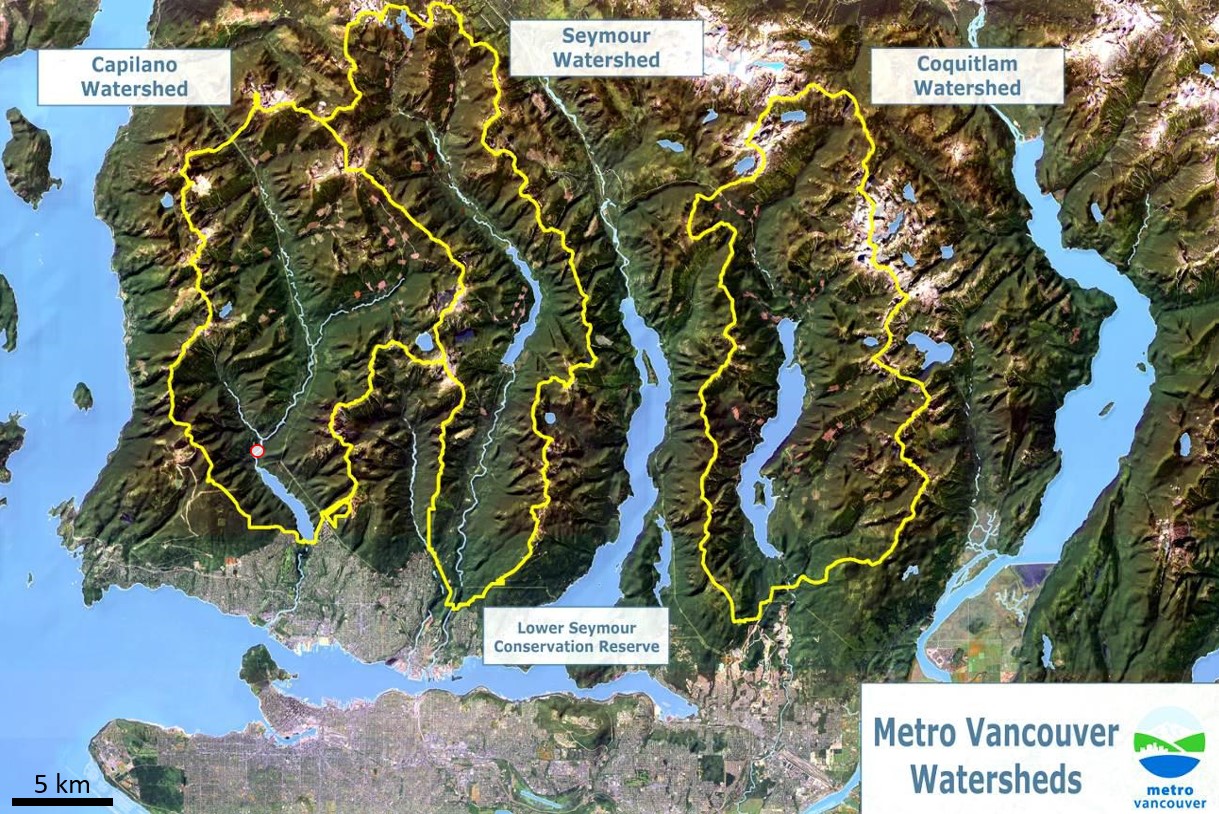
Managed watersheds are drainage basins in which humans have created structures to alter the natural hydrograph to make more water available across the whole year. For example, Metro Vancouver’s water supply comes from three drainage basins on the north shore of Burrard Inlet, as shown in Figure 11.5.6. This map illustrates the concept of a drainage basin divide. The boundary between two drainage basins is the height of land between them. A drop of water falling on the boundary between the Capilano and Seymour drainage basins (a.k.a., watersheds), for example, could flow into either one of them.
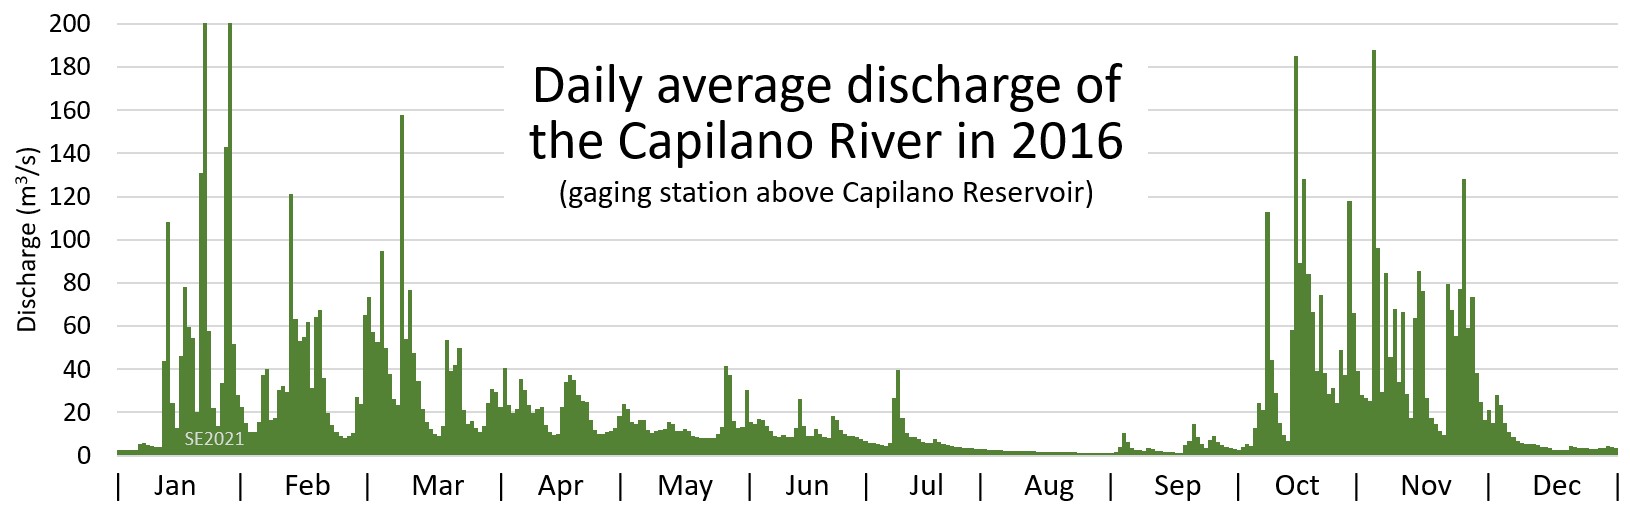
All of these basins have large reservoirs that have been created by the building of dams. The reservoirs provide water storage for times when the flow in the streams is low. As shown on Figure 11.5.7, the discharge on the Capilano River where it enters the Capilano Reservoir is similar to that of the Englishman River on Vancouver Island, but also has some sustained summer flow, like the Ashnola River in the interior. The Capilano basin is surrounded by peaks in the 1500 m range, and much of its basin is above 800 m. These higher-altitude areas accumulate thick snow that provides significant meltwater flow into early July.
Surface water supplies for many other cities are not as pristine as Vancouver’s because there may be industry, agriculture, recreation and human habitation within the watersheds. In such cases much greater care needs to be taken to check for industrial toxins, farming chemicals and animal wastes, highway runoff, human wastes and effluent from landfills, and to remove any such contaminants.
Exercise 11.5 Where Does Your Water Come From?
Unless you have your own private source—such as a groundwater well—you probably get your water from a municipal or corporate water provider. Municipalities and corporations go to considerable effort to ensure that the water they provide is safe and of sufficient quantity. Because water it so important to our well being, it is incumbent on all of us to have eyes on our water providers and to find out what they are doing to keep us supplied with sufficient clean water.
For starters, we should find out where the water is coming from. If it is from a river, where on that river? If it is a groundwater source, where are the wells, how deep are they, what aquifer are they completed in? Secondly, we should think about the potential sources of contamination around the water source areas: agriculture, logging, sewage treatment plants, landfills, industry, urbanization etc. Thirdly, we should find out how the water is treated and how often is it tested.
Take a moment to find out as much as you can about your own water supply. You can do that by doing an internet search with words like “cityname water supply”. Try to answer the questions above. If you can’t, then maybe you should contact the relevant municipal or corporate officials and politely ask some questions about the water supply that you depend on.
Media Attributions
- Figure 11.5.1 Steven Earle, CC BY 4.0
- Figure 11.5.2 Steven Earle, CC BY 4.0
- Figure 11.5.3 Steven Earle, CC BY 4.0
- Figure 11.5.4 Steven Earle, CC BY 4.0, based on Open Government License – Canada data at Water Survey of Canada, Environment Canada, https://wateroffice.ec.gc.ca/
- Figure 11.5.5 Steven Earle, CC BY 4.0, based on Open Government License – Canada data at Water Survey of Canada, Environment Canada, https://wateroffice.ec.gc.ca/
- Figure 11.5.6 Copyright Metro Vancouver. Used with permission.
- Figure 11.5.7 Steven Earle, CC BY 4.0, based on Open Government License – Canada data at Water Survey of Canada, Environment Canada, https://wateroffice.ec.gc.ca/