3.2 Plate Tectonics and Climate Change
Steve Earle
As described in Chapter 2, plate tectonics allows the plates of the Earth’s lithosphere to move around on the surface over time. This has resulted in many different configurations of continents over geological time, and also in plate-boundary interactions that have led to volcanism and the formation of mountain ranges.
Continental Positions
At present, the continents (which make up 29% of the Earth’s surface) are almost evenly distributed in a latitudinal sense, with approximately 33% in equatorial regions (between 30⁰ north and 30⁰ south), 38% in temperate regions (between 30⁰ and 60⁰ north and south), and 29% in polar regions (north of 60⁰ north and south of 60⁰ south).
This matters to climate because different types of Earth surfaces reflect different proportions of the energy that we get from the sun. That reflectivity is called albedo. Land surfaces are more reflective than open water, and some land surfaces are more reflective than others. Snow- and ice-covered surfaces have albedos in the range of 70 to 90%, unvegetated surfaces are generally in the range 15 to 40% (lower if wet), while vegetated surfaces are in the range 10 to 20%. Open water of oceans or lakes has an albedo of less than 10%. That means that 90% of the sun’s energy that shines on water is absorbed and converted into heat (in the form of warm water). Only about 10% of the sunlight that hits fresh snow is converted into heat; the rest is reflected back into space.
A critical factor in the context of albedo is latitude, because albedo makes a much bigger difference at low latitudes (equatorial regions), where solar intensity is high throughout the year, than it does at high latitudes, where solar intensity isn’t very high—even in the summer—because the sun never gets very far above the horizon.
At approximately 720 Ma the situation was much different than it is now, as shown on Figure 3.2.1. Most of the land area was part of the supercontinent Rodinia, with 50% of it in equatorial regions, 40% in temperate regions, and only 10% in polar regions. That much land in the sensitive equatorial zone had a cooling effect because of the higher albedo of the land (which was even higher than it is now since there was no land vegetation at that time [1]) compared to the ocean. Most of the sunlight striking that land reflected back into space, and was not converted into heat. The albedo implication of a supercontinent centred on the equator—more sunlight reflected back into space—is considered to be an important contributor to the first of the Cryogenian Period Snowball Earth glaciations.[2]

Starting at around 720 Ma the Earth entered its most intensive and the most extensive glacial period. The small temperature forcing caused by the albedo effect of an equatorial supercontinent (estimated at about 3⁰ C of cooling) led to snow and ice accumulation at high elevations and higher latitudes. Lower temperatures also favoured transfer of more of the atmosphere’s CO2 into the oceans. Those feedbacks soon drove more intense cooling and before too long the land was mostly glaciated. This is known as the Sturtian Glaciation; it lasted about 60 million years. For much of that time the Earth’s mean annual temperature was about minus 40⁰ C, and the entire ocean—even at the equator—was covered in more than 200 meters of ice. Because there was little liquid water anywhere at surface, the hydrological cycle was essentially shut down.
Sixty million years is a very long winter but considering that the bright icy surface reflected most of the incoming solar energy, it might have been longer still (perhaps even until now). Our saving grace is that the Earth’s internal heat engine still motored on over that time, and volcanoes continued to erupt. Along with those eruptions came gases, including CO2, and because there was no open ocean water almost all of that volcanic CO2 stayed in the atmosphere, gradually building a greenhouse effect strong enough to start melting the ice. It is likely that the CO2 level had to reach about 13% (about 325 times the current level of 0.04%) in order to overcome the cold.[3] As some of the terrestrial glaciers receded, positive feedbacks started working to enhance the warming, including the decrease in albedo caused by melting ice, and the release of both carbon dioxide and methane from melting permafrost.
Eventually the sea ice started to melt, and it was probably mostly gone within several thousand years. This relatively rapid transformation from reflective ice and snow to dark open water for the entire ocean, under an atmosphere with at least several per cent CO2, would have then contributed to an intense “hothouse” climate for at least another several thousands or tens of thousands of years.
Exercise 3.1 Visualizing Continental Positions
There are various places on the internet where you can find ways to visualize how the positions of the continents have changed over time. You can view this example from TRU, or this one from BioInteractive, but you may be familiar with others.
Using one of those tools, scroll through some of geological time to see if there have been periods, other than the late Proterozoic (Figure 3.2.1), when there was a greater concentration of continental crust near to the equator than there is now, or times when more of the land was closer to the poles than is the case now. Is there evidence that such variations might have affected past climates?
Exercise answers are provided Appendix 2.
Mountain Ranges
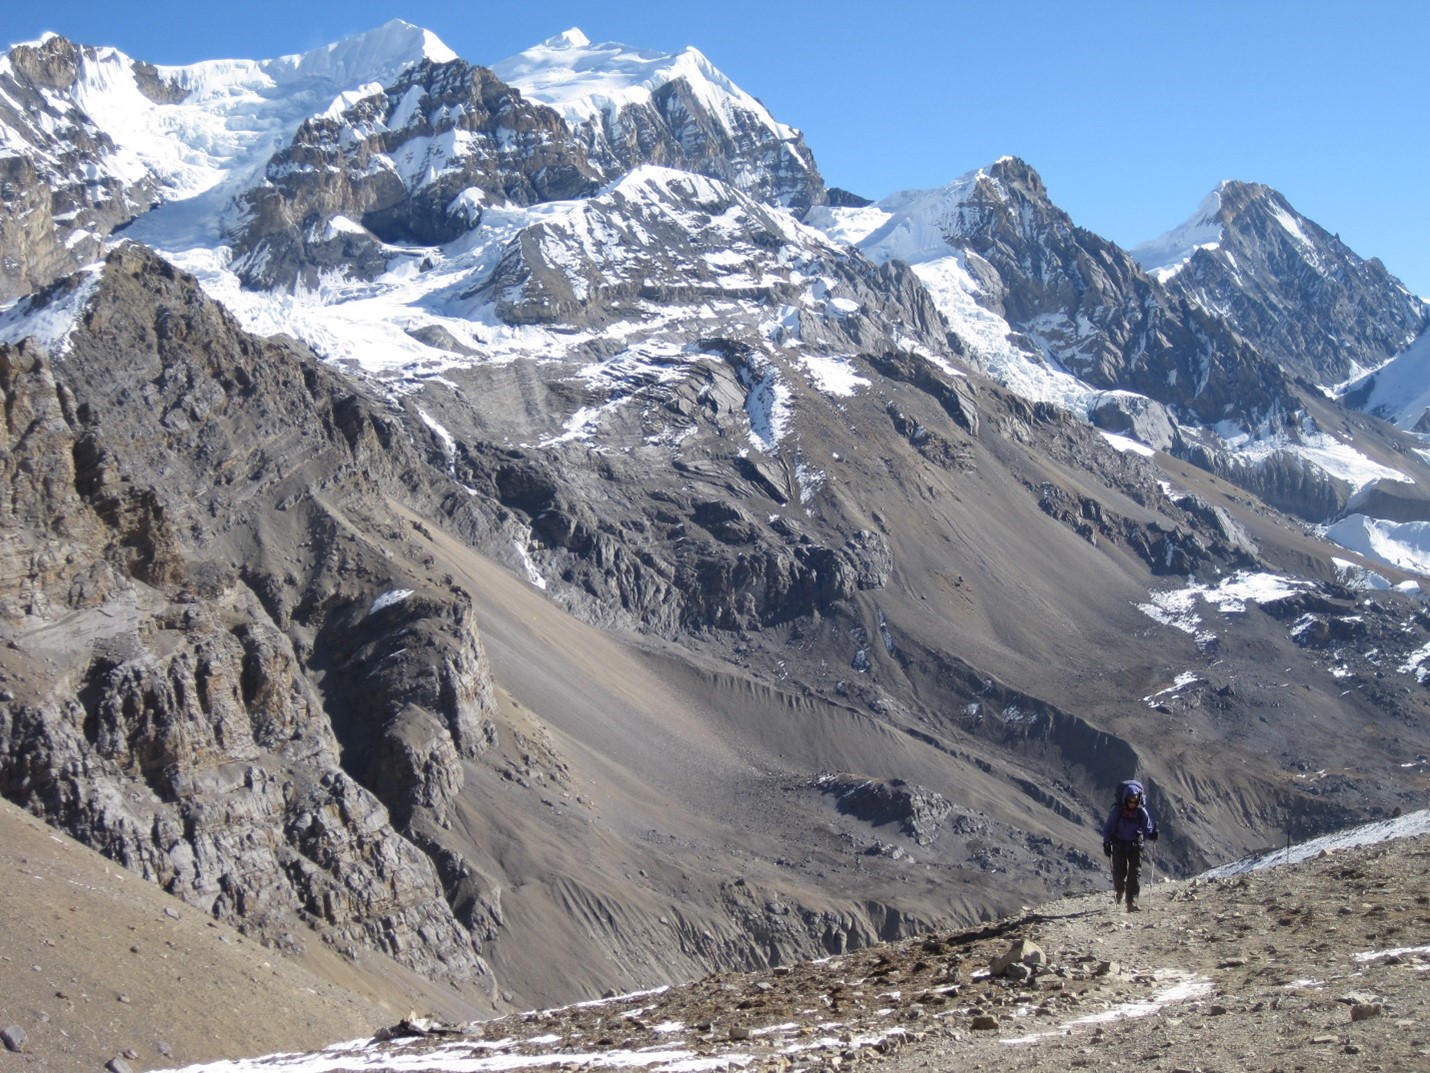
At about 100 Ma, the plate carrying the Indian continent started diverging from Antarctica and moved north towards Asia. While that was happening, the continents were eroding and sediments and sedimentary rocks were accumulating on the ocean floor adjacent to both continents. When India reached Asia, sometime between 55 and 45 Ma, the continental part of the Indian plate was unable to subduct (as illustrated on Figure 2.4.3). Instead, the rocks making up northern India and southern Asia, plus the sedimentary rocks in between, got crumpled, folded, faulted and uplifted to start construction of what is now—by a wide margin—the Earth’s highest and most extensive range of mountains (Figure 3.2.2).[4] This uplift continued for tens of millions of years. In fact, the Indo-Australian Plate is still moving north, and still pushing the mountains up.
The Himalayans aren’t the only significant mountains to have been formed in relatively recent geological times. Others include the Zagros and adjacent mountain ranges of Iran, Iraq and Turkey, and the Alps of Europe, which were built mostly within the period of 65 to 40 Ma. All of these ranges can also be attributed to continental collisions.
Mountainous parts of the continents erode many times faster than plains (Figure 3.2.2). The Himalayan Range, which extends over 2400 km from Myanmar to Pakistan and well north into southern China, is eroding faster than any similar sized area on the planet and has been doing so for close to 50 million years. One of the processes associated with that erosion is chemical weathering of the rocks. This takes many forms, but the one of interest to us here is the hydrolysis (see Box 3.2) of silicate minerals, such as feldspar, to form clay minerals—and the resulting consumption of atmospheric carbon dioxide.
Hydrolysis is the process through which a molecule is split apart by water. In the context of mineral weathering, it can be represented like this:
[latex]\ce{H2O + CO2 -> H2CO3}[/latex]
water + carbon dioxide [latex]\ce{->}[/latex]carbonic acid
This process can be written like this:
[latex]\ce{CaAl2Si2O8 + H2CO3 + 1/2O2 -> Al2Si2O5(OH)4 + Ca^2+ + CO3^2-}[/latex]
feldspar + carbonic acid + oxygen [latex]\ce{->}[/latex] kaolinite + calcium ions + carbonate ions
in which feldspar reacts with water, carbonic acid to form the clay mineral kaolinite along with calcium and carbonate ions in solution. The key thing happening here is that carbon dioxide is coming out of the atmosphere, first to form carbonic acid (H2CO3), and then reacting with feldspar to become carbonate ions that will eventually reach the ocean and get fixed into a mineral like calcite (CaCO3), and will become part of a limestone deposit.
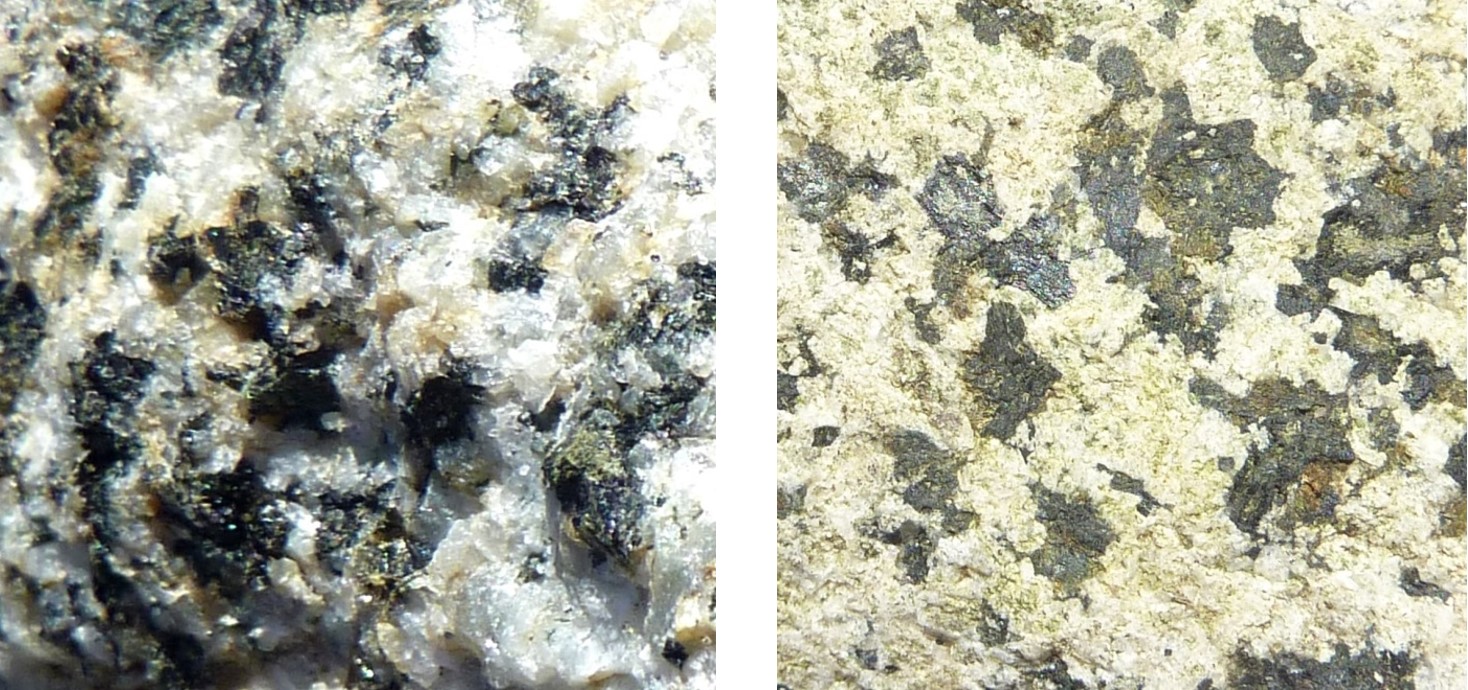
The effects of hydrolysis are illustrated on Figure 2.3.3, which shows unweathered (left) and weathered (right) parts of the same piece of granite. The surfaces of the feldspar crystals have been weathered to the clay mineral kaolinite.
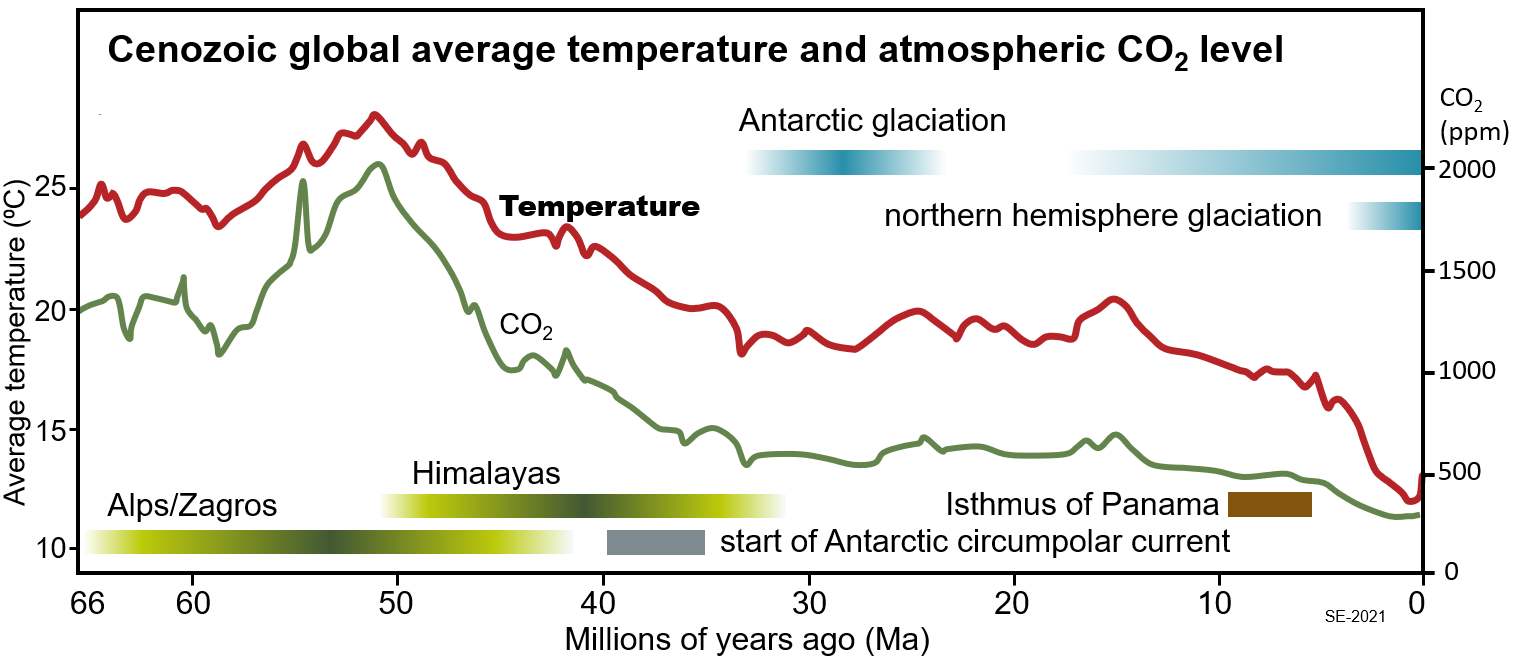
The relationship between mountain building and global temperatures during the Cenozoic (since 66 Ma) is illustrated on Figure 3.2.4. Temperatures were consistently high through the Mesozoic (from 261 to 66 Ma) and that continued into the early part of the Cenozoic, but the climate started to cool around 50 Ma, and since then there has been a cumulative drop in global temperatures of about 14⁰ C. This long-term decline closely follows the atmospheric CO2 curve, and most of that change can be attributed to the enhanced weathering associated with mountain ranges like the Himalayas, and therefore to plate tectonics. As described below, there are some other factors that contributed to climate change during the Cenozoic.
Ocean Currents
Plate tectonic processes have also been responsible for climate change in other ways. For example, the movement of plates can change the characteristics of ocean basins, and that can change ocean currents, and therefore, the climate. Prior to about 40 Ma, the southern end of South America was either still connected to Antarctica, or at least the passage between them was too shallow to allow significant water flow. Sometime between 41 and 34 Ma that body of water—the Drake Passage—was widened and deepened by plate motion, and since then the strong Antarctic Circumpolar Current has flowed around the continent in a west to east direction (Figure 3.2.5).

This current has the effect of isolating Antarctica from relatively warm ocean currents of the southern Pacific, Atlantic and Indian Oceans. That has kept warm water away from Antarctica and is responsible for the glaciation of the southern continent starting at about 35 Ma and continuing until today (with a possible interruption between 25 and 15 Ma) (Figure 3.2.4).
Between about 100 Ma and 10 Ma North and South America were separated from each other by a waterway hundreds of kilometers wide; under those conditions water was able to flow freely between the Pacific and Atlantic Oceans. But there was ongoing subduction of oceanic crust beneath what is now Central America. In a manner similar to what is shown on Figure 2.4.2, that process led to formation of magma above the subducting plate. That led to many millions of years of volcanic activity, and to the formation of a series of volcanic islands within what is now Central America (Figure 3.2.6). Finally, at around 10 Ma, those volcanic islands coalesced into an isthmus that opened the way for land animals to pass between North and South America but blocked the Central American Seaway.
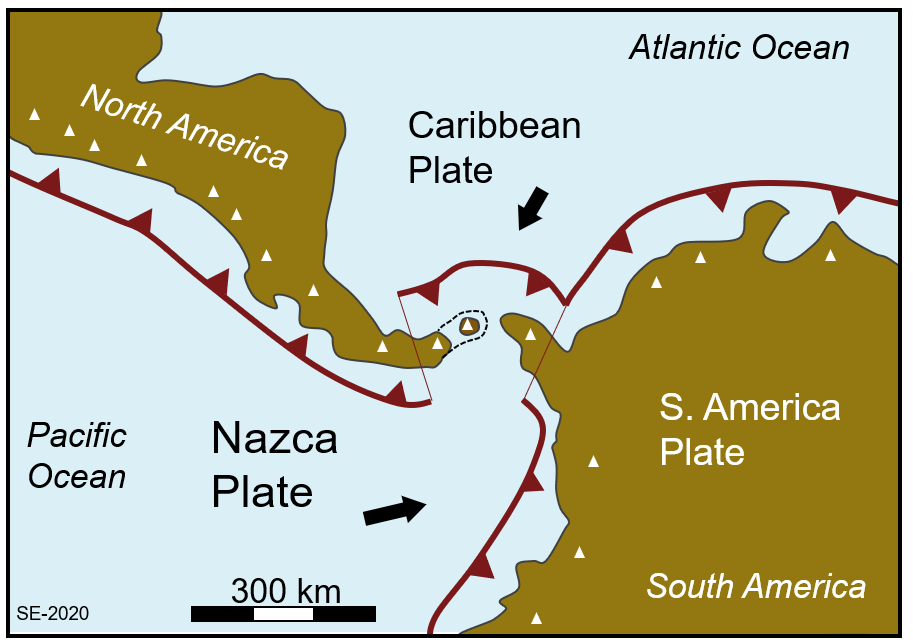
That change had the effect of making the Gulf Stream (and the entire Atlantic circulation system) more intense, and the warm water flowing north brought more warmth and more moisture to the northern Atlantic. Ironically, that additional warmth and moisture led to more intense snowfall in Iceland, Greenland, northern North America, and northern Europe, and thus to a lower albedo, and eventually to the beginning of the Pleistocene Glaciations.[5] The northern hemisphere has been repeatedly glaciated since 2.5 Ma, in cycles that have remarkably regular periodicity. The origin of those cycles is discussed in Chapter 6.
Media Attributions
- Figure 3.2.1 Steven Earle, CC BY 4.0
- Figure 3.2.2 Photo by Isaac Earle, used with permission, CC BY 4.0
- Figure 3.2.3 Steven Earle, CC BY 4.0
- Figure 3.2.4 Steven Earle, CC BY 4.0, based on information from studies by James Hansen and others compiled by Root Routledge and posted at Alpine Analytics, http://alpineanalytics.com/Climate/DeepTime.html
- Figure 3.2.5 Steven Earle, CC BY 4.0
- Figure 3.2.6 Steven Earle, CC BY 4.0; based on León, S. et al. (2018). Transition from collisional to subduction‐related regimes: An example from Neogene Panama‐Nazca‐South America interactions. Tectonics, 37(1), 119-139. https://doi.org/10.1002/2017TC004785
- Plants first came onto land at around 450 Ma. ↵
- The Cryogenian Period lasted from 720 to 635 Ma, and included two snowball glaciations: the Sturtian, from about 717 to 660 Ma, and the Marinoan, 650 to 635 Ma. ↵
- Crowley, T., Hyde, W., & Peltier, W. (2001). CO2 levels required for deglaciation of a 'near-snowball' Earth. Geophysical Research Letters, 28(2), 283–286. ↵
- There are 131 mountains in the world that are over 7000 m tall. All of them, yes all of them, are part of the Himalayas or adjacent ranges. Most of the mountains taller than 5000 m are also in the Himalayan region. ↵
- Bartoli, G. et al. (2005). Final closure of Panama and the onset of northern hemisphere glaciation. Earth and Planetary Science Letters, 237(1-2), 33–44. https://doi.org/10.1016/j.epsl.2005.06.020 ↵