13.3 Managing Floods and Limiting Flood Damage
Steve Earle
There are several ways to reduce the risks associated with flooding, including limiting the potential for flooding in the first place, controlling where floodwaters go, and taking steps to limit the amount of damage that floods cause.
One of the best ways to reduce the risk of flooding is to do just the opposite of what we do most of the time in urban areas, namely constructing endless highways, roads and parking lots, and countless buildings. Paved surfaces and roofs do not absorb water effectively, so relatively little of it infiltrates into the ground to become groundwater; instead, most runs off the surface. The runoff coefficients for a range of different surface types are illustrated on Figure 13.3.1.
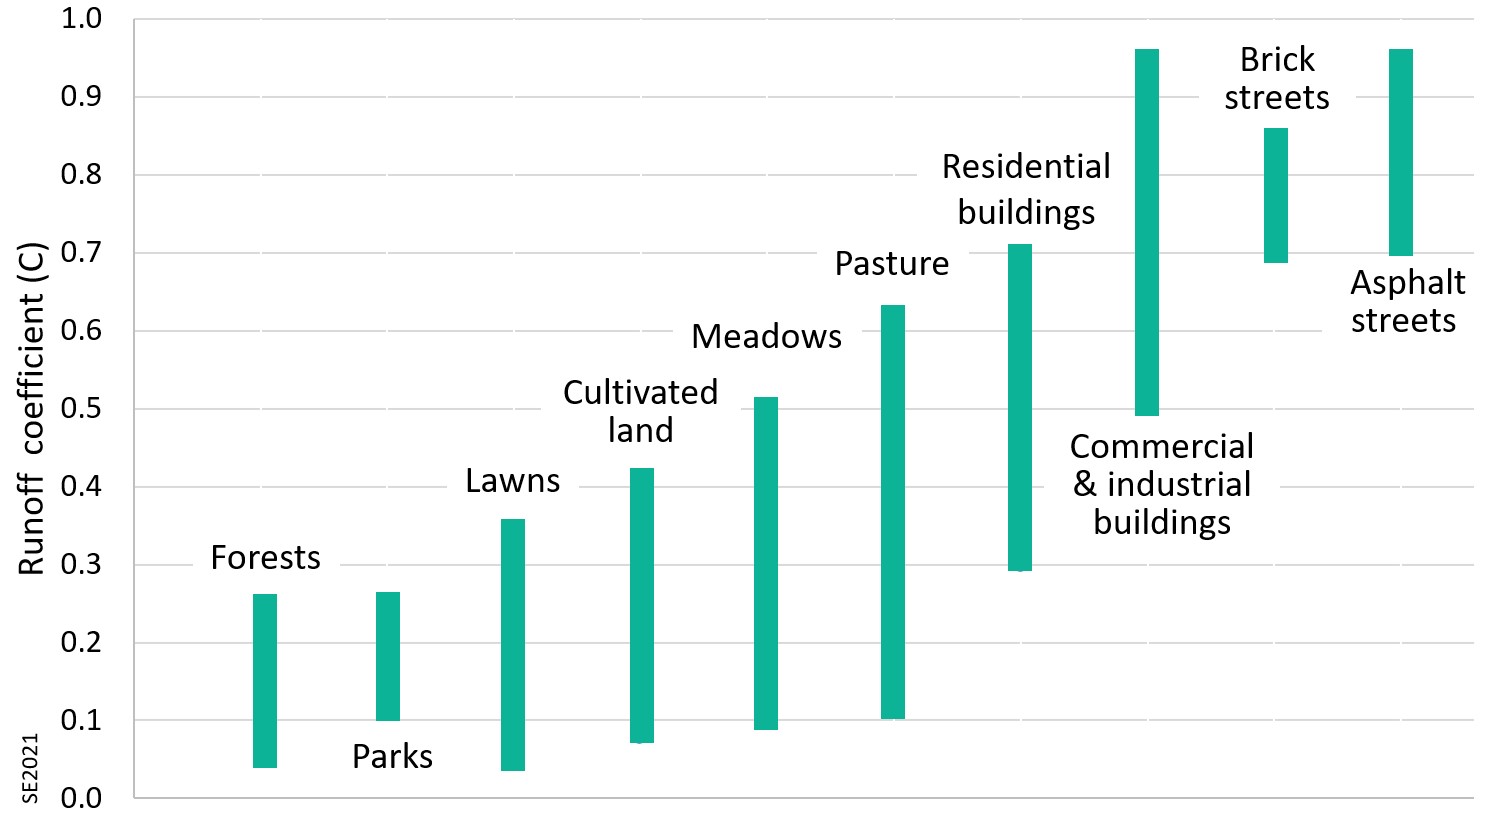
The runoff coefficient is an estimate of the proportion of rain from a significant storm that will flow over a surface to become runoff, rather than infiltrating into the ground. Only a small proportion of the rain that falls in parks or forests—5 to 25% of it—becomes surface flow; the rest—75 to 95% of it—infiltrates into the ground and becomes part of the groundwater, and then moves very slowly towards surface drainages, thus delaying and reducing the ultimate size of a flood. For cultivated land, meadows and pasture, 10 to 65% of the precipitation runs across the surface, directly into streams and lakes, while 35 and 90% of the water infiltrates. For roads and streets 70 to 95% flows over the surface, or through ditches and storm sewers directly into surface water bodies, while only 5 to 30% infiltrates. Obviously, increasing the amount of infrastructure (roads, parking lots, buildings) in an area, increases the amount of water that will flow quickly into drainage systems and so will amplify the potential for flooding. On the other hand, conserving forests in their natural state, and creating parks that have minimal infrastructure will reduce the potential for flooding.
Exercise 13.2 Estimating Flood Runoff
If a storm brings 50 mm of rain over a period of 4 hours, how much water will run off an area of 1 km2? Since 50 mm is 1/20th of a metre, a cubic metre of water would fall on each area of 20 m2. There are 50,000 squares of that size within a square kilometre, and so that is a total volume of 50,000 cubic metres, which is about 20 Olympic-size swimming pools.
For simplicity, we’ll assume that all of that water ends up in a single stream channel flowing off of the kilometre square, and that it all flows away over a period of 6 hours. If the area is densely urbanized, like the middle of Vancouver, BC (Figure 13.3.2, left), we can assume that the runoff coefficient is something like 0.75, meaning that 37,500 m3 will flow off the square kilometre over 6 hours (21,600 seconds). That represents a flow rate of 37,500/21,600 = 1.7 m3/s, something like a small river at low flow. Meanwhile, 12,500 cubic metres of water will infiltrate to become groundwater.
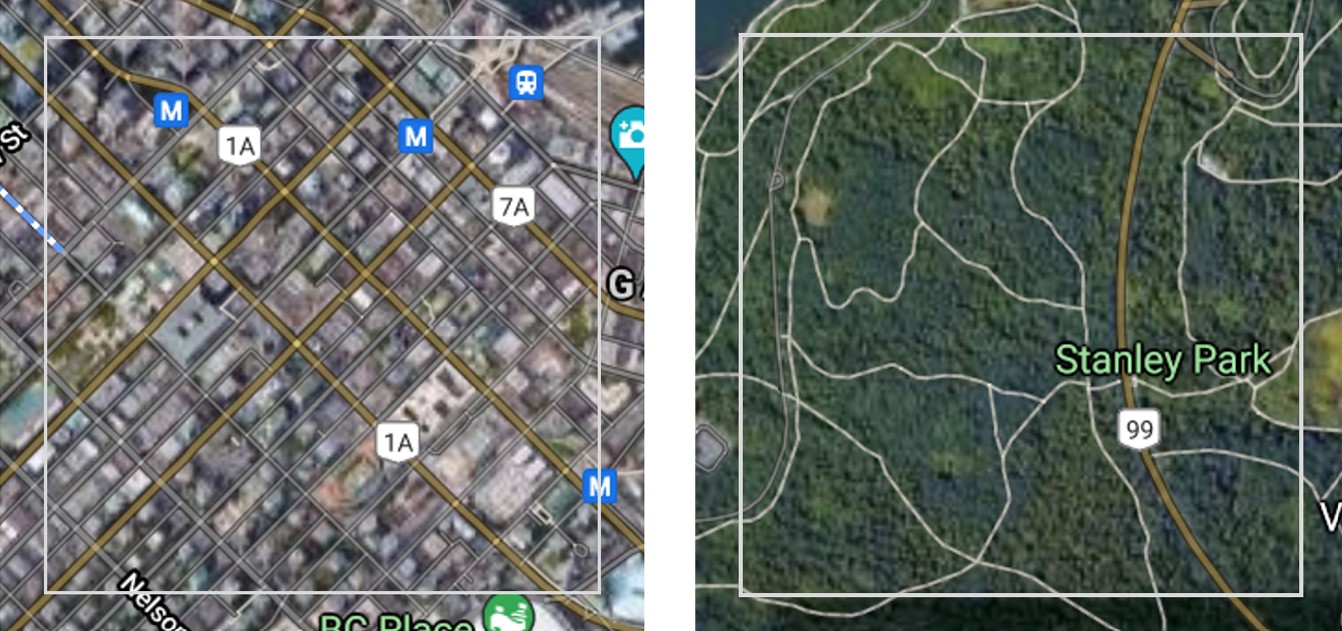
Now do the same calculation for a square kilometre in nearby Stanley Park (image on the right) where the runoff coefficient is 0.15. What is the total amount of surface runoff from that area, and what would be the discharge rate of the stream if it all ends up in one channel? What volume of water infiltrates to become groundwater in this case?
Exercise answers are provided Appendix 2.
Some ways to reduce the flooding potential impact of existing urban regions include: reducing the area covered by hard surfaces, making hard surfaces (e.g., roads) more permeable, replacing roads and parking lots with parks and community garden plots, constructing ponds or wetlands to capture runoff, and creating dips and hollows (swales) in landscaped areas to slow the rate of flow and increase the rate of infiltration.
We can control floodwaters by building dams, dykes and channels. The High Aswan Dam in Egypt is a good example of that, although there are significant downsides to the construction of large dams (as described in Section 9.2). A dyke or levee is a berm built along one or both sides of a river to prevent flood waters from spilling out onto the floodplain. An artificial channel can be constructed separate from the normal channel to carry a portion of the flow of a river during flood events.
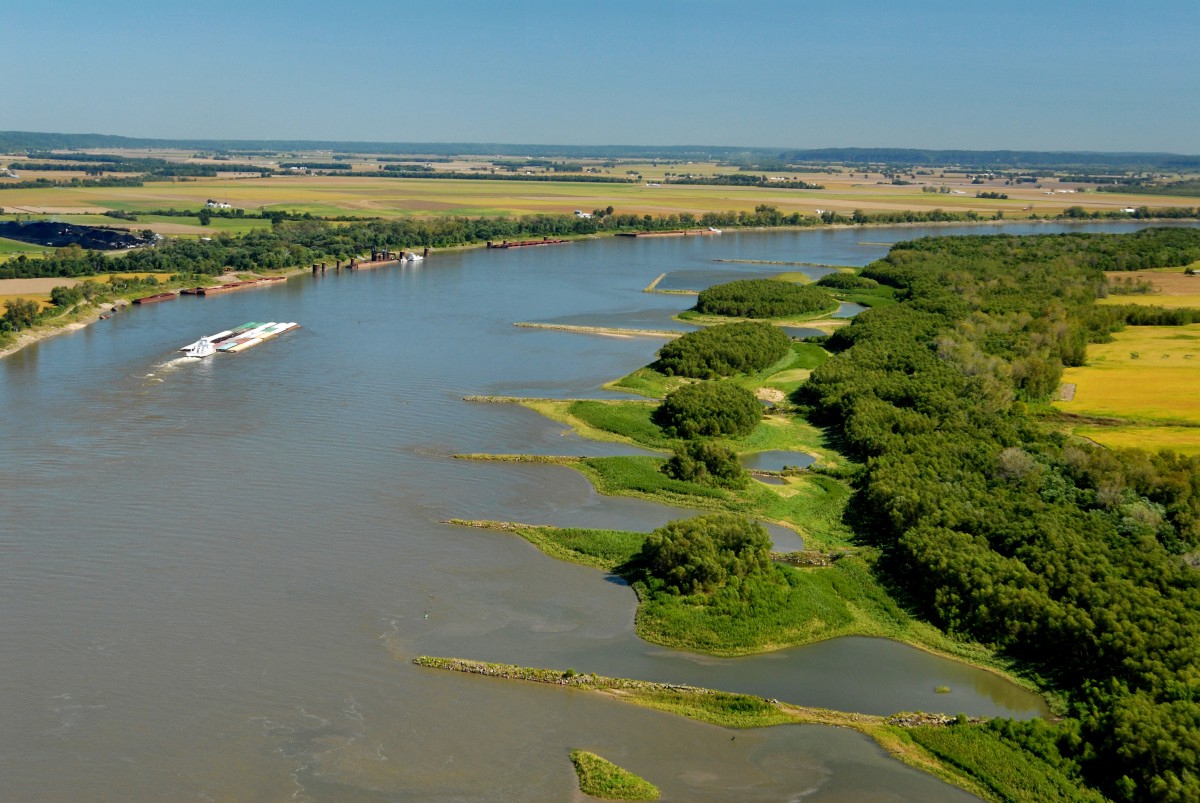
The Mississippi-Missouri-Ohio river system is the largest in North America, with a drainage basin that covers more than 40% of the US and even a small part of Canada. It has great historical significance and has been a critical transportation corridor for over two centuries. The Mississippi is one of the most controlled rivers in the world. There are 64 major dams on the Mississippi, Missouri and Ohio Rivers, and hundreds of others on their tributaries. There are over 5600 km of dykes (a.k.a., levees) along the sides of the rivers, and thousands of other structures that have been built to make the water go where it is wanted, or to keep the shipping channels open. Wing dykes, for example are constructed within the river channel at an angle to the shore and are designed to keep most of the water flowing in the central part of the channel so as to limit the extent to which that part fills with sediment (Figure 13.3.3). In spite of all of the engineering works on the Mississippi system (or in some cases because of them), the tendency for flooding has increased over the past century. According to Pinter et al. (2008),[1] although climate change has made flooding more likely over that time, “the largest and most pervasive contributors to increased flooding on the Mississippi River system were wing dikes and related navigational structures, followed by progressive levee construction. In the area of the 2008 Upper Mississippi flood, for example, about 2 m of the flood crest is linked to navigational and flood‐control engineering. Systemwide, large increases in flood levels were documented at locations and at times of wing‐dike and levee construction.”
Wing dykes were constructed to enhance navigation on the Mississippi system (not to reduce flooding), but Pinter et al. found that they resulted in increases in water levels in upstream areas because the wing dykes acted like dams. Levees were constructed to control flooding, but Pinter et al. found that they led to increased flooding downstream because they resulted in a loss of water storage in flood plains.
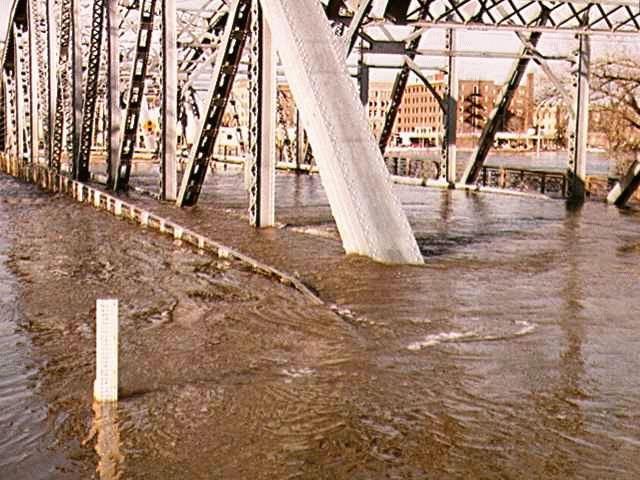
The north-flowing Red River in Minnesota, North Dakota and Manitoba floods frequently due to rapid spring snow melt. The flooding typically starts in the south (Minnesota and North Dakota), where melting begins earlier, and builds towards the north. There have been many serious floods at various locations along the river, with major events in 1950, 1997, 2009 and 2011. The 1997 floods caused an estimated $3.5 billion in damages on both sides of the border.
Most of the floods on the Red River takes place in spring, and often when at least some parts of the river are still ice-covered. In several cases, ice jams, where broken sheets of ice accumulate in the river and block the flow, have exacerbated the severity of the flooding.
After the 1950 Red River flood the Government of Manitoba started building a 48 km long and 150 m wide channel around Winnipeg to provide extra capacity for Red River flood waters and to reduce the potential of flooding in the city (Figure 13.3.4). Known as the Red River Floodway, the channel was completed in 1964 at a cost of $63 million. Since then, it has been used many times to channel water away from Winnipeg and reduce flood risks in the city and is estimated to have saved billions of dollars in flood damage. The massive 1997 flood was almost too much for the floodway; in fact, the amount of water diverted was greater than the designed capacity. The capacity of the floodway has since been increased so that it can be used to divert more of the Red River’s flow away from Winnipeg.

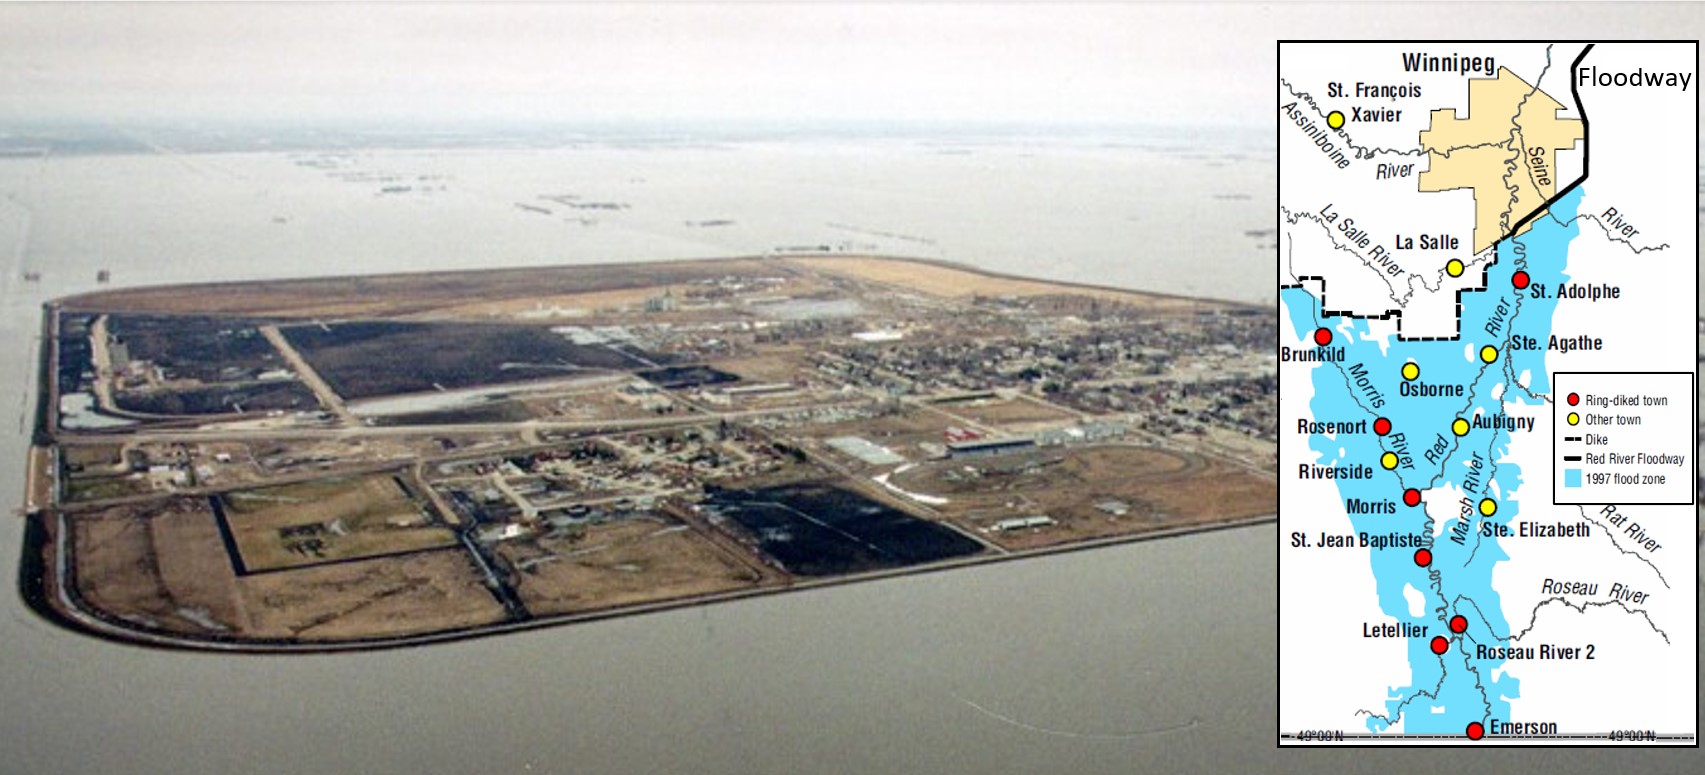
Manitoba also has an east-west trending dyke system that is intended to help control Red River floods (Figure 13.3.5). During the 1997 flood this helped protect the city of Winnipeg, but acted like a dam, creating a temporary lake of over 1400 square km that surrounded a dozen smaller communities to the south. Some of those, like Morris, had ring dykes to protect them, while others, like Ste. Agathe and Aubigny, did not. Most of the buildings in the unprotected towns were flooded, as were many farm buildings outside of the towns.
After 1997 the twin cities of Grand Forks, with help from their state governments and the federal government, made some major changes along both banks of the Red River creating what is known as the Greenway. Over 850 houses, plus 900 other buildings, were either removed (as they had been badly damaged by the flooding) or moved, and 850 properties were purchased.[2]
The area was converted into parkland with over 30 km of cycling and walking paths, two golf courses, three disc golf courses, and various sports fields. At the same time, the floodwalls (dykes) on either side were made stronger and higher (Figure 13.3.7).
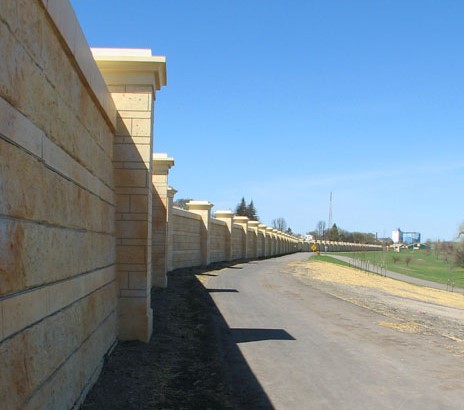
Next time there is a major flood on the Red River in the Grand Forks area there will be less infrastructure that can be damaged within the floodplain and fewer lives put at risk, the new higher flood walls should protect more of the communities’ urban areas, and the now more permeable surfaces in the floodplain will help to reduce the magnitude of the flood, rather than increase it.
There were significant floods on the Red River in North Dakota in 2009 and 2011. Although the floodwall contained most of the water in both cases, neither of these floods was as extreme as the 1997 flood.
Exercise 13.3 Investigate a Stream
It’s time to get outside and look for evidence of flooding on a stream (a trickle, a creek or a river) near to where you live. In most places you may be able to get there on foot, although if you live in a big city most small streams may have been forced underground. One way or another, there’s likely to be a stream near enough for you to go and have a look. You may have to look at several places along the stream to find the features we’re looking for here.
Here are some things to look for (or research):
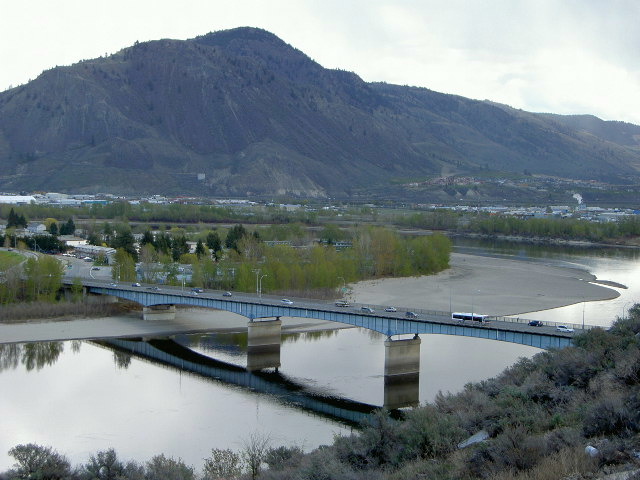
- Does it have a flood plain, an area of flat ground on one side or the other (or both) that might have been flooded in the past? (Most mature streams have floodplains. Figure 13.3.8 shows the Thompson River where it flows through Kamloops, BC. There is a floodplain on the far side, but not on this side, where the bank is steep. The sandbar in the middle would be submerged annually during spring flows, while the treed area behind it might only flood at extreme flows.)
- Is there any evidence of a natural levee (that could be very difficult to see or identify), or is there any type of dyke or levee that has been constructed to prevent flooding? Or can you see any erosion protection (large angular rocks for example) along the stream banks?
- Is there a dam at any location upstream or downstream? If so, why was it built, and is it used for flood control?
- Has there been any flooding on this stream in the past, and was there significant damage?
Media Attributions
- Figure 13.3.1 Steven Earle, CC BY 4.0, based on Hydrology data from LMNO Engineering, Research and Software, http://www.lmnoeng.com/Hydrology/rational.htm
- Figure 13.3.2 Steven Earle, CC BY 4.0, using images from Google Earth, https://earth.google.com/
- Figure 13.3.3 River Training Structures from US Army Corps of Engineers, public domain, https://www.army.mil/article/70627/river_training_structures_innovative_engineering_keeps_a_dynamic_river_open_for_navigation
- Figure 13.3.4 Map by Steven Earle, CC BY 4.0. Photo 2000-118 by G. R. Brooks, 1997, Natural Resources Canada, courtesy of the Geological Survey of Canada, Open Government License-Canada, https://www.manitoba.ca/iem/geo/pflood/photo2.html
- Figure 13.3.5 Government of Manitoba, OpenMB Information and Data Use Licence, https://www.gov.mb.ca/mit/wms/rrf/historical_1997.html, and extent of flooding south of Winnipeg in April and May 1997; (inset) Statistics Canada, Open Government License-Canada, https://www150.statcan.gc.ca/n1/pub/11-402-x/2011000/chap/geo/c-g/desc/desc04-eng.htm
- Figure 13.3.6 Sorlie Bridge by US Army Corps of Engineers, public domain image via Wikimedia Commons, https://commons.wikimedia.org/wiki/File:Sorlie_bridge_1997.jpg
- Figure 13.3.7 Grand Forks Floodwall by Lazy Lightning, 2007, CC BY 2.0, via Wikimedia Commons, https://commons.wikimedia.org/wiki/File:Grand_Forks_Floodwall.jpg
- Figure 13.3.8 Overlanders Bridge by R. Sieben, 2006, CC BY 3.0, via Wikimedia Commons, https://commons.wikimedia.org/wiki/File:Overlanders_Bridge,_Kamloops_B.C._-_panoramio.jpg