9.1 Solar and Wind
Steve Earle
Solar Energy
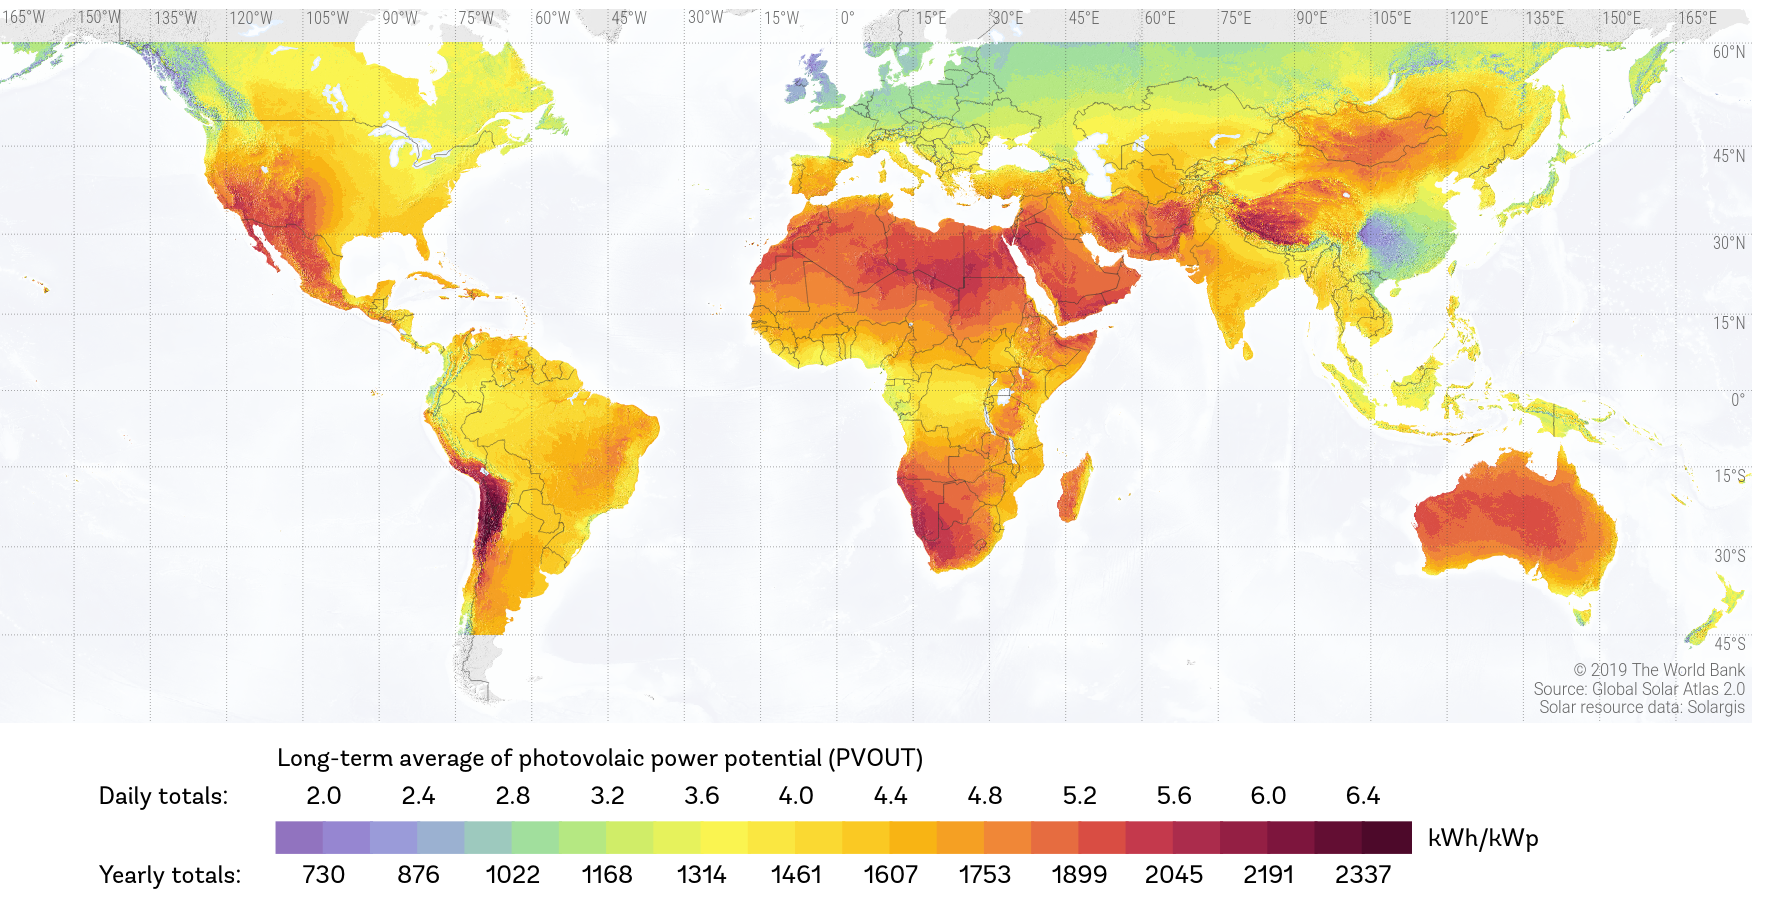
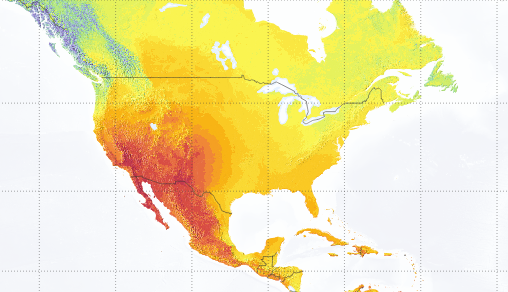
We use solar energy to grow food of course, and for some industrial processes (like concentrating lithium brines), and to passively heat buildings, but early in the 21st century the most important and fastest growing use of solar energy is for generating electricity. Solar energy is abundant. The amount of sunlight energy received on Earth is approximately 10,000 times the amount of energy consumed by humans in 2005.[1] As shown on Figure 9.1.1, solar potential is greatest in sub-tropical regions, but it is also significantly affected by weather conditions, and is highest in drier climates. That is why the dry central region of southern Canada, for example, has much greater solar potential than the wetter and cloudier west coast, even at the same latitude.
There are two main ways to generate electricity from the sun. One is through heat, the other through photovoltaic cells. The Crescent Dunes facility in Nevada is an example of solar heat electricity generation (Figure 9.1.2). This facility has 10,347 movable mirrors that reflect sunlight onto a tower in the centre of the complex. The highly concentrated sunlight is used to heat molten salt that powers a steam turbine to generate electricity. The hot molten salt retains enough heat to continue producing electricity for 9 hours after sundown, and therefore the plant can operate through the high electricity-demand period in the evenings. The Crescent Dunes station operated from 2016 to 2019 but is currently shut down because of technical issues with the molten salt container.[2] Solar thermal energy has the disadvantage of relatively high capital and operating costs, such that the electricity production cost at most existing plants is currently higher than for some other sources, including photo-voltaic solar. But it has the advantage of short-term energy storage, which allows for energy production into the evening when it’s need most and that could outweigh higher production cost in areas where there are time-of-day premiums on the value of electricity.
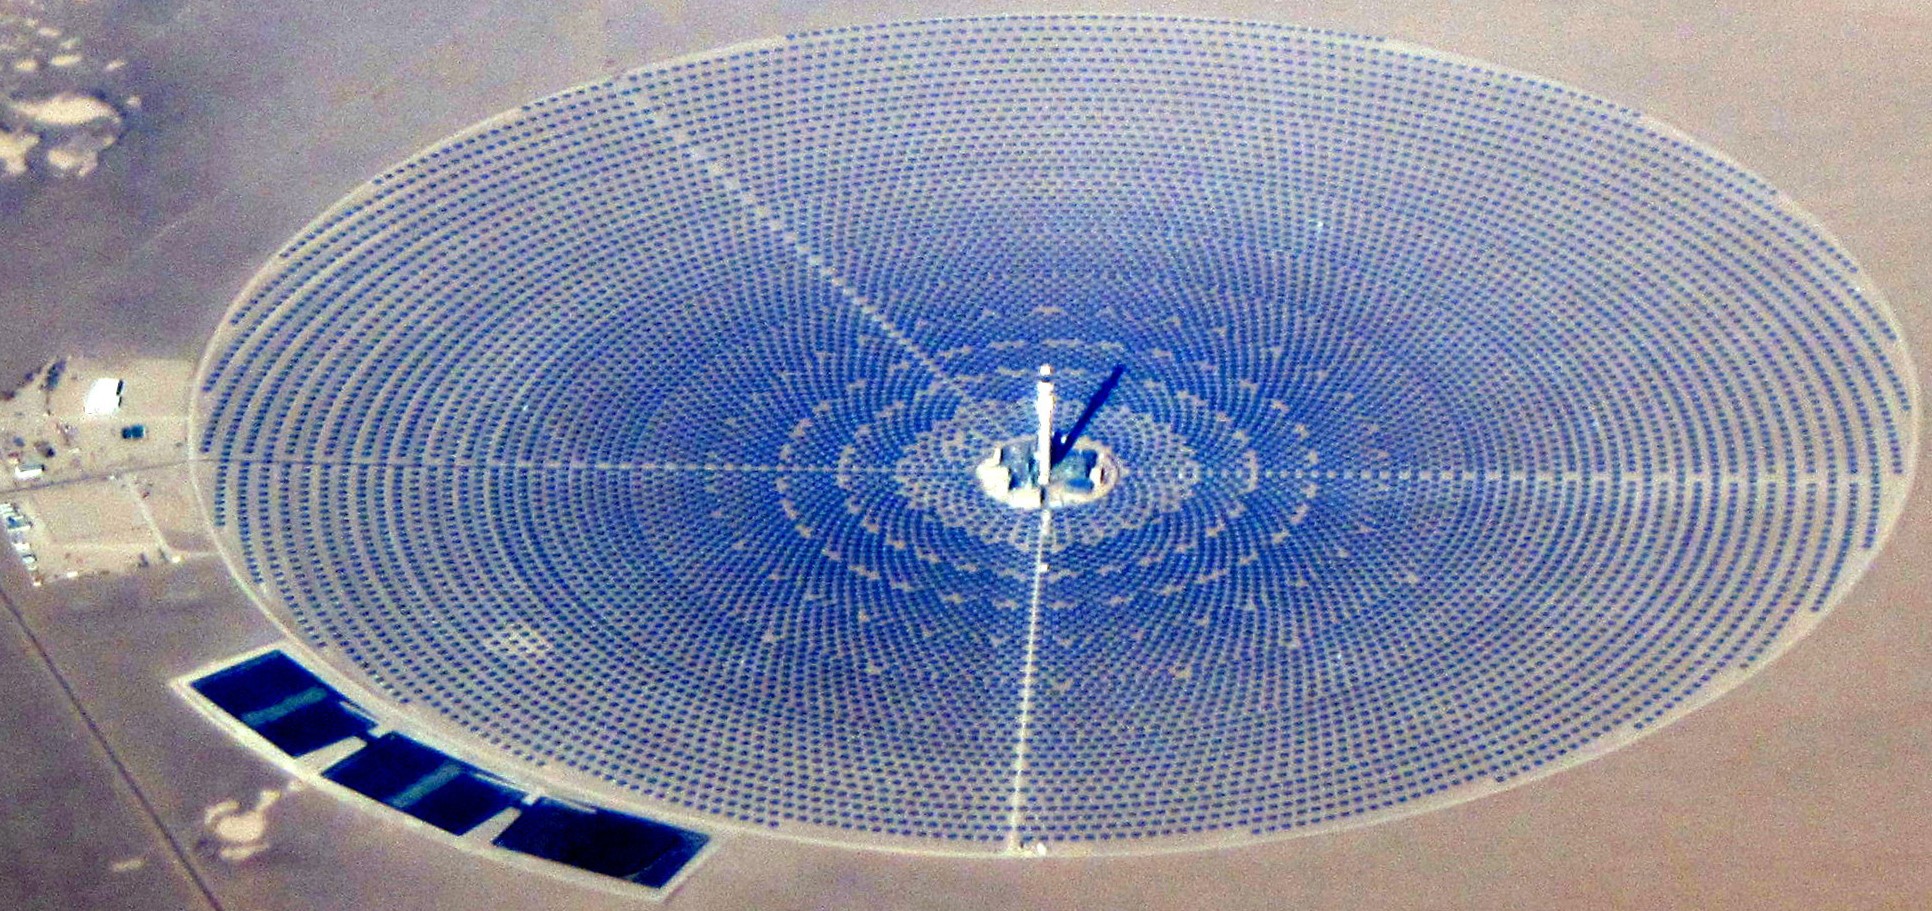
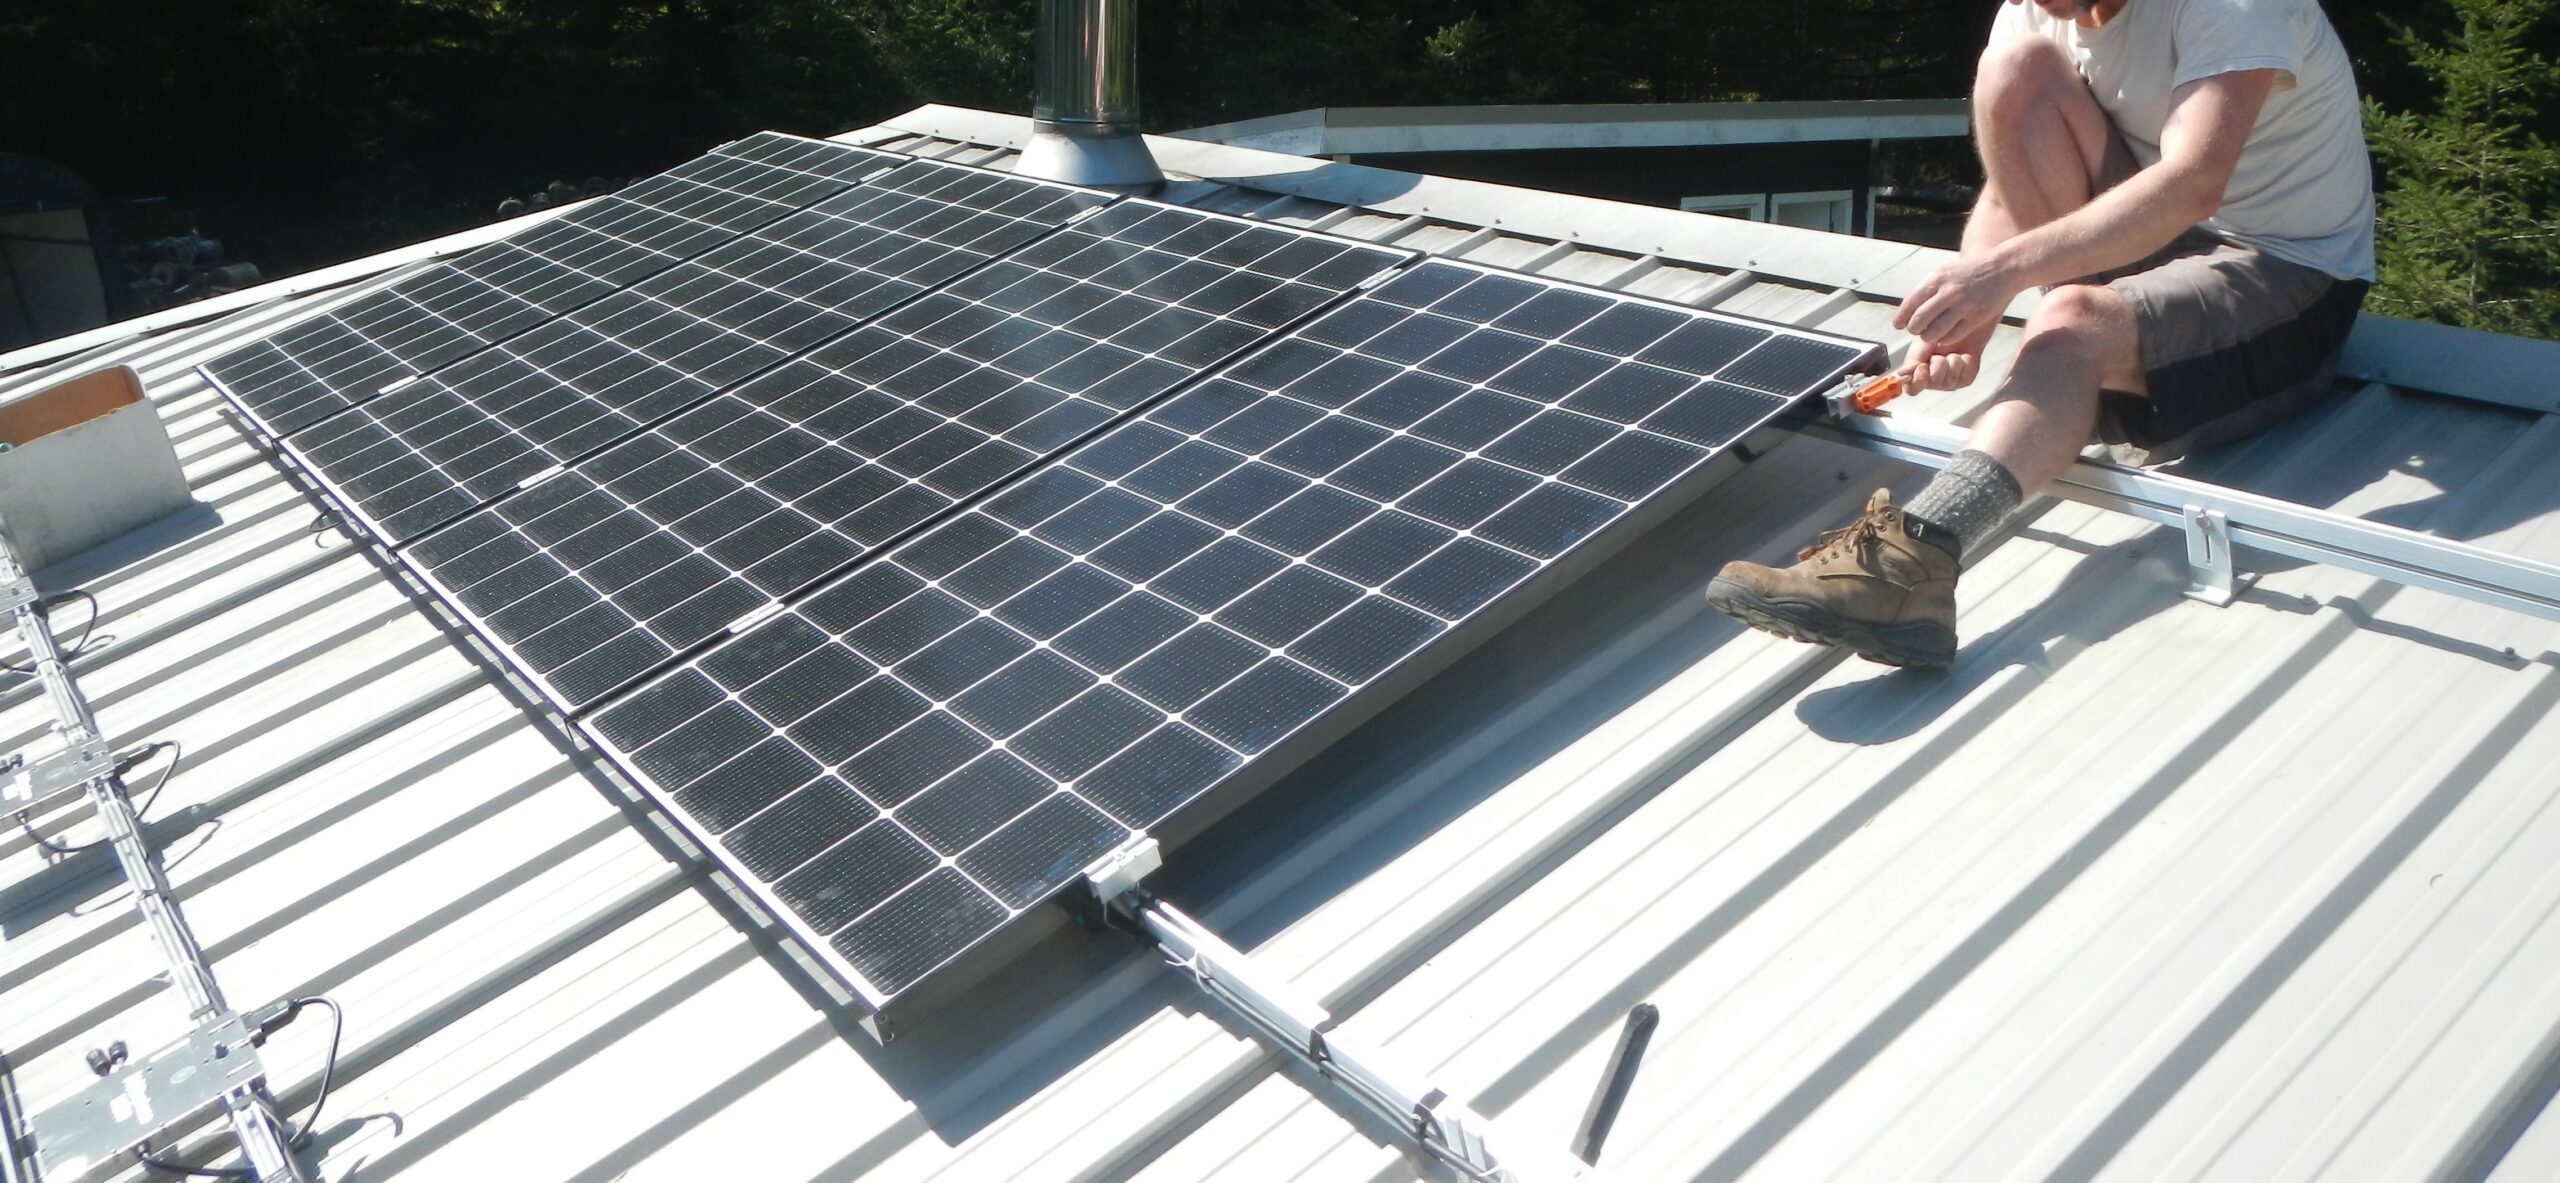
Photo voltaic solar (or PV) is based on the use of cells that convert sunlight directly to electricity. Solar PV is easily scalable, from several modules on a single roof (Figure 9.1.3) to thousands of modules at a utility-scale facility (Figure 9.1.4). The efficiency of solar PV technology has increased significantly over the past several decades. Commercially available modules have evolved from about 10% efficiency in the 1970s to about 20% efficiency in the early 2020s. Experimental solar cells are now operating at about 40% efficiency—meaning that 40% of the sun’s energy that strikes them is converted into electricity. While efficiency has gone up over that period, costs have come down dramatically. According to the International Energy Agency the average cost of solar PV modules has dropped from over $100/watt in 1975, to $10/W in 1987, to $1/W in 2015, and to $0.2/W in 2020.[3]
Box 9.1 Watts and Watt Hours
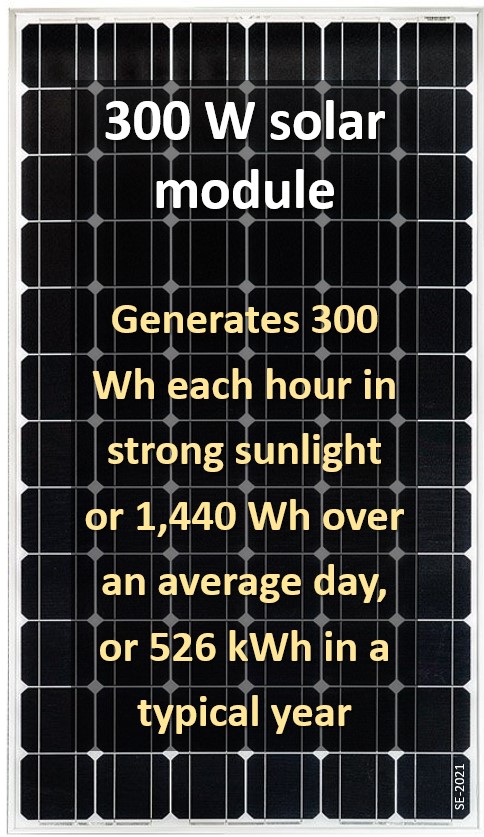
In this chapter we are talking about power and energy using the terms Watts and Watt hours. A Watt is a measure of power, which is the rate that energy is produced or consumed by a device. A 10 W LED light bulb consumes electricity at a rate of 10 W. A Watt is already a rate, so we don’t need to use something like “W/hour”. A 300 W solar panel in full sunlight generates electricity at a rate of 300 W. Each hour at that rate it will produce 300 W hours of energy. A 300 W solar module could power thirty 10 W light bulbs for as long as the sunlight holds up.
During each hour of full sunlight, a 300 W solar module will generate 300 Wh (Watt hours) of energy. A solar installation like the one in Figure 9.1.3, has a capacity factor of about 20%, meaning it can only generate about 20% of its rated power over the course of a year (because of darkness and cloud cover). In one average day each module in that system will generate 24 x 300 x 0.2 = 1,440 Wh of energy (or 1.44 kWh). In one year, each module will generate 1.44 x 365 = 526 kWh.
In the context of large energy projects, we need bigger numbers to express the rate of power generation, such as MW (Mega-Watts or 1,000,000 W) or GW (Giga-Watts or 1,000,000,000 W), or energy production, such as MWh and GWh.
Solar PV modules (and thermal solar) do not generate electricity all of the time, certainly not when the sun is down, and not that well under cloudy conditions. In areas with a reasonably good solar resource the capacity of solar modules is about 20% of the rated wattage. In other words, 100 modules rated at 250 watts (25 kW) should produce electricity at an average rate of 5 kW, or should generate 43,800 kWh of energy over the course of a year, which is about enough to power 4 houses in North America, more than that in Europe.
According to the International Renewable Energy Agency solar represented 23% of the world’s renewable energy supply in 2019, and that proportion is growing. The increasing efficiency and decreasing cost of solar PV modules has made it a viable option for a large part of the energy supply in a world without fossil fuels. The US National Renewable Energy Lab has estimated that a national grid with 55% solar and wind sources—both of which are intermittent—could be viable if the remaining power sources can be ramped up and down to even out the supply. Energy storage (such as pumped hydro or batteries) could also help to make this a reality.
A typical solar PV module, like those shown on Figure 9.1.3, contains about 76% glass (by weight), 10% plastic, 8% aluminum (in the frame), 5% silicon and 1% other metals (as wires and connectors). It takes energy to make these components and assemble them, but the amount of embodied energy is small compared with the amount of energy that can be produced by the module. The energy output of a solar module depends significantly on the region and the setting in which it is installed, but a modern well situated solar module should recover its energy costs in approximately one year,[4] and the module should last for at least 25 years. Furthermore, many parts of a solar module are easily recyclable (or re-usable) including the glass and the metal frame. The silicon in the cells can also be melted for re-use. Even though the modules can be recycled, a significant increase in the use of solar-PV energy (which is what we need) will require more mining to supply the raw materials.
Exercise 9.1 Solar Potential
Using Figure 9.1.5 (or Figure 9.1.1 if you live outside of this area), determine the solar energy potential of your region. If you live in a reddish area, the potential is very high (score 3), orange: high (score 2) and yellow: moderately high (score 1).
Now think about the potential of the place in which you live (the building, or the piece of land around it). If there are places (on the roof, on the ground, or even on the walls) that get at least 4 hours of direct sun in a day (averaged year-round, and not counting bad weather), then your potential is moderate (score 1), if it’s 6 hours/day then it’s good (score 2), and if it is at least 8 hours/day then it is very good (score 3).
If the sum of your two scores is 4 or higher, then your place is likely to be viable for solar power, and that means that the cost of installation of solar panels would probably be recovered in about 10 years (or less). Of course, there are many other factors, such as the nature of your building, the cost of electricity, and the willingness of your electric utility to let you tie in to the grid.
Wind Energy
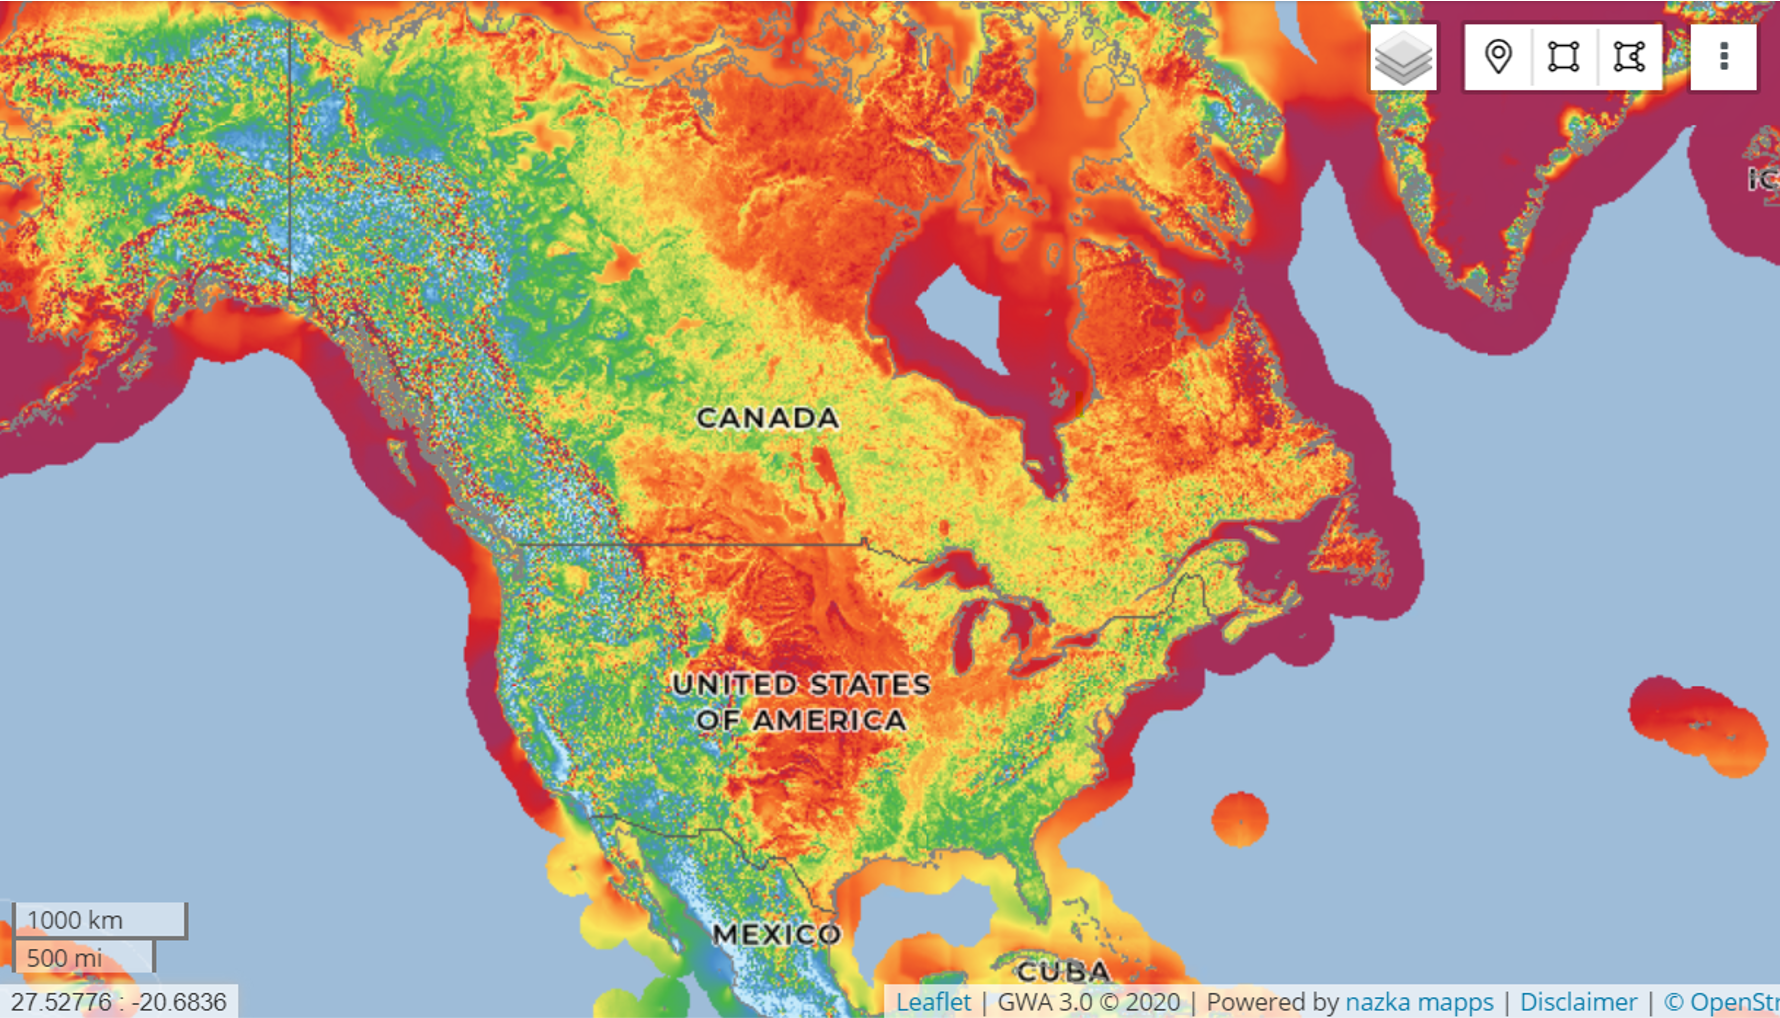
Wind is a product of solar energy and gravity because air masses move in response to differences in air density created by solar heating. Wind energy has been used for centuries to turn windmills and to power sailing vessels, but it’s only in the past few decades that wind has been used to generate electricity. As shown on Figure 9.1.5, wind is geographically variable as an energy resource. Average wind speeds are higher on the oceans than on land, and consistently higher in flat areas compared with mountainous areas. In North America the best wind resources are in eastern coast offshore, especially north from Virginia, and in western coast offshore areas, from California north, within the Great Lakes and Hudson Bay, and within the plains in both the US and Canada. Mountain ridges also have consistently strong winds.
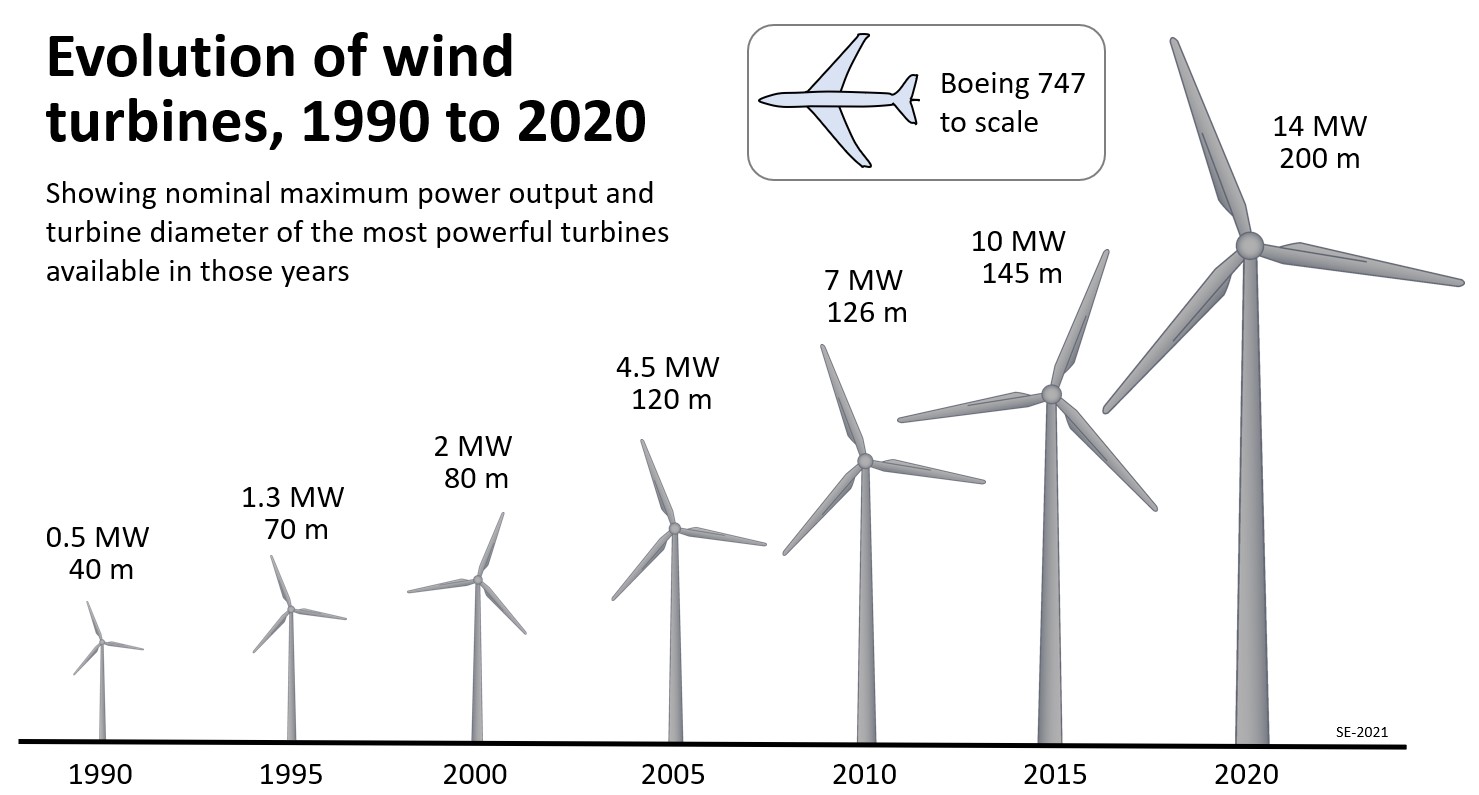
Most utility-scale wind turbines are of the horizontal axis type, mounted on a tall tower. Over the past 30 years the power potential of wind turbines has increased by a factor of nearly 30 times (Figure 9.1.6) and the towers have become very tall. Of course, a 10 MW wind turbine doesn’t generate power at 10 MW all of the time. The typical capacity factors for land-based turbines are in the order of 30%, while offshore turbines are higher, at around 40%. The tall 10 MW and higher turbines being installed in offshore locations in the mid 2020s are likely to have even higher capacity factors because wind consistency increases with elevation. Most existing offshore turbines are embedded in the sea floor in areas with water depths of less than 50 m. Floating turbines have been developed for use in areas with deeper water. A single 10 MW offshore turbine operating at 50% capacity can generate enough electricity to power about 4,000 homes in North America.
According to the International Renewable Energy Agency wind energy makes up about 25% of installed renewable energy. Based on data from 2019, China and the US have the highest installed wind generation capacity, but Denmark has the highest proportion of wind-generated electricity, at 48%, followed by Ireland (33%), Portugal (27%), Germany (26%), the UK (22% – see Figure 9.1.7) and Spain (20%).[5]
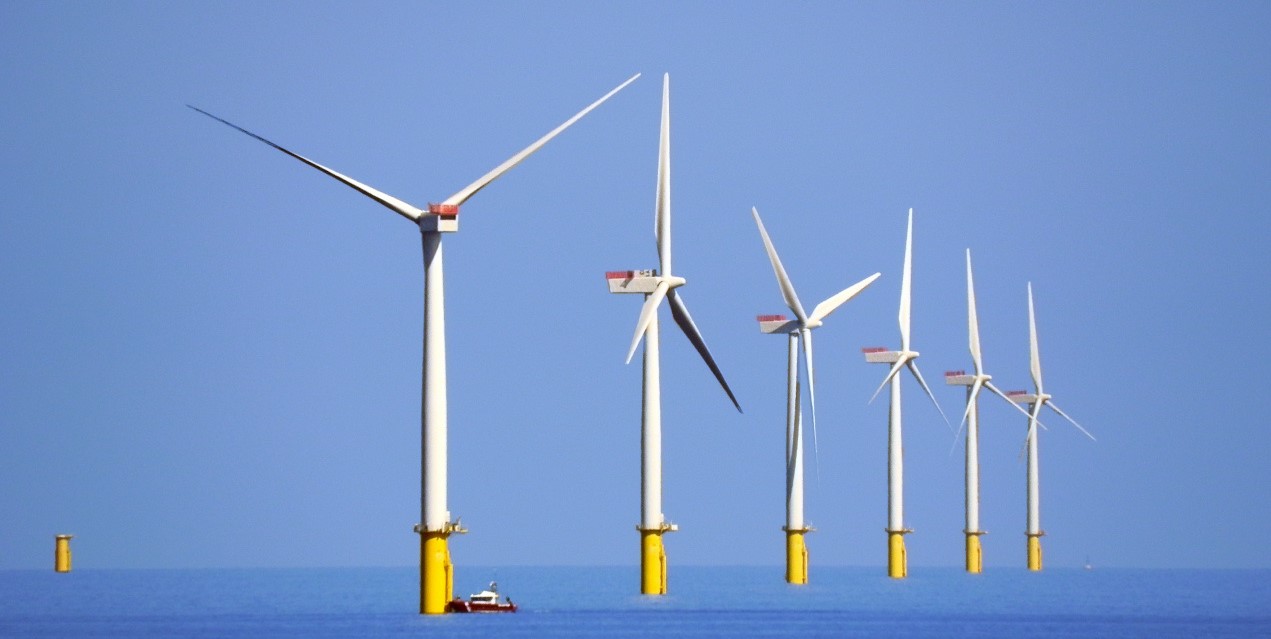
Modern wind turbines are large and complex, and their manufacture and installation require a lot of materials and energy. For example, a typical 3 MW turbine, similar to the ones on Figure 9.1.7, includes about 1100 tonnes of concrete for the base on the sea floor (or on land), 276 tonnes of steel, for the base the tower and the nacelle (the housing that holds the generating mechanism, and to which the blades are attached), 2.6 tonnes of copper and 2.3 tonnes of aluminum, and 20 tonnes of fibreglass and epoxy resin for the blades.[6] As for solar modules, the energy payback of a turbine will depend on the features of the location selected, but it is typically less than one year, compared with an expected lifetime of at least 20 years. Much of this material can be recycled when the turbine is decommissioned.
Every year thousands of birds (and bats) are killed by wind turbines, although the rate of bird-kill is decreasing because the newer larger turbines spin slower than older models, and because a range of strategies are being developed to decrease the risk. To put this in perspective, millions of birds are killed each year by power lines, moving vehicles and tall buildings, and the total number from all of these sources of mortality is dwarfed by the number killed by domestic cats.
Solar and wind power are currently the cheapest forms of electricity generation according to the US Energy Information Administration. The average levelized cost of solar is $0.30 per kWh, while that for onshore wind is $0.37 per kWh. All other forms of electricity generation are more expensive, including gas, coal, hydro and nuclear.[7] While most other energy forms are likely to become more expensive in coming years, solar and wind are likely to get cheaper because of technological improvements and economies of scale.
Exercise 9.2 Intermittent Wind and Solar Resources
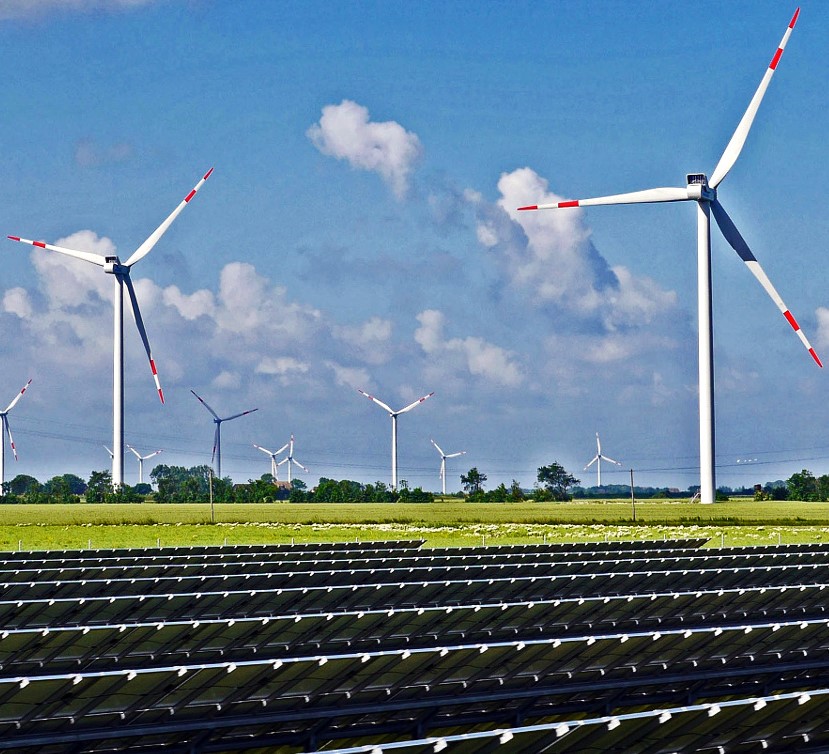
A combined wind turbine and solar PV energy facility (like the one shown on Figure 9.1.9). has been established to serve an area with about 50,000 homes in southern Alberta It comprises 150,000 solar modules at 600 W each (total capacity 90 MW) and 20 wind turbines at 5 MW each (total capacity 100 MW). The region is often sunny and has good wind resources, but of course there are cloudy days and dark winter days, and there are calm days.
The following table, which is based on the weather conditions for a week in late spring, shows how many hours of strong sunlight equivalent* there are on each day to power the modules at their 600 W capacity, and how many hours of strong wind equivalent are available to power the turbines at their rated 5 MW capacity.
Complete the other rows of the table to work out the average amount of energy produced by each system on each of the 7 days, and the total amount of energy produced. For example, to estimate the daily energy production for the solar array, in MWh, multiple the number of hours of strong sun equivalent by the total capacity of the system (90 MW). For wind, multiply the hours of strong wind equivalent by the total capacity (100 MW). The first column (Monday) is done for you.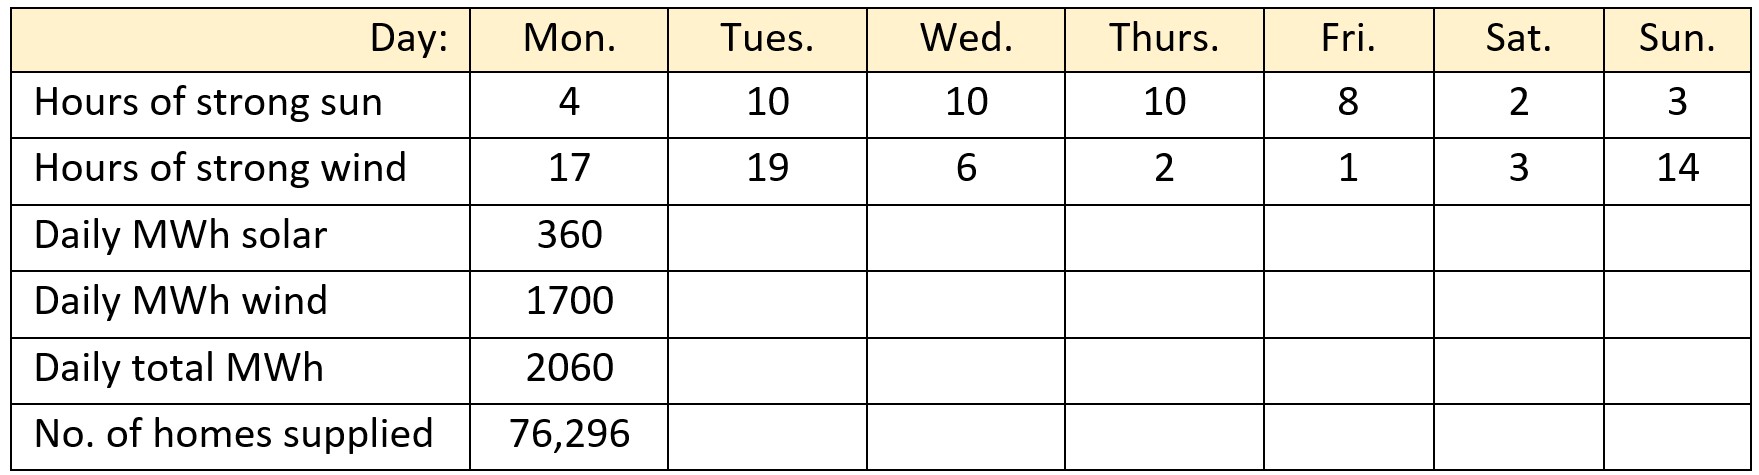
An average house in North America uses about 10 MWh of electricity per year, which is equivalent to 0.027 MWh per day, so if you divide the “Daily total MWh” by 0.027 you can estimate the number of homes that can supplied with electricity by this system on each day.
As the facility operator, what do you plan to do with the extra electricity on days when you have a surplus, and to keep your customers supplied with electricity on days when you don’t have enough?
*For example, on a given day there might be 4 hours of strong sunlight, 3 hours of weak morning or evening sunlight, and 6 hours with conditions ranging from partial to complete cloud. These might all add up to 8 hours of “strong sunlight equivalent”.
Exercise answers are provided Appendix 2.
Media Attributions
- Figure 9.1.1 Global Map of Photovoltaic Power Potential by The World Bank, 2017, CC BY 4.0, via Wikimedia Commons, https://commons.wikimedia.org/wiki/File:Global_Map_of_Photovoltaic_Power_Potential.png
- Figure 9.1.2 Crescent Dunes Solar by Amble, 2014, CC BY-SA 4.0, via Wikimedia Commons, https://commons.wikimedia.org/wiki/File:Crescent_Dunes_Solar_December_2014.JPG
- Figure 9.1.3 Photo by Steven Earle, CC BY 4.0
- Figure 9.1.4 Horizontal Single Axis Tracker in Greece by Vinaykumar8687, 2013, CC BY-SA 4.0, via Wikimedia Commons, https://commons.wikimedia.org/wiki/File:8MW_horizontal_single_axis_tracker_in_Greece.JPG
- Figure 9.1.5 Global Map of Photovoltaic Power Potential by The World Bank, 2017, CC BY 4.0, via Wikimedia Commons. https://commons.wikimedia.org/wiki/File:Global_Map_of_Photovoltaic_Power_Potential.png
- Figure 9.1.6 From Global Wind Atlas 3.0, a free, web-based application developed, owned and operated by the Technical University of Denmark (DTU) and released in partnership with the World Bank Group, utilizing data provided by Vortex, using funding provided by the Energy Sector Management Assistance Program (ESMAP). CC BY 4.0 For additional information see: https://globalwindatlas.info
- Figure 9.1.7 Steven Earle, CC BY 4.0, based on data in Molina, M. and Mercado, P. (2011). Chapter 16 Modelling and control design of pitch-controlled variable speed wind turbines. In Al-Bahady, I. H. (Ed), Wind turbines. IntechOpen, https://www.intechopen.com/chapters/14810
- Figure 9.1.8 Walney Offshore Windfarm by David Dixon, 2011, Walney Offshore Windfarm CC BY-SA 2.0, via Wikimedia Commons, https://commons.wikimedia.org/wiki/File:Walney_Offshore_Windfarm_-_geograph.org.uk_-_2391702.jpg
- Figure 9.1.9 Renewable Energy Park by hpgruesen, CC0 1.0, via Wikimedia Commons, https://commons.wikimedia.org/wiki/File:Renewable_energy_park.jpg
- Smil, V. (2005). Energy at the crossroads (presentation). OECD Global Science Forum Conference on Scientific Challenges for Energy Research. http://vaclavsmil.com/wp-content/uploads/docs/smil-article-2006-oecd.pdf ↵
- Wikipedia contributors. (2021, November 7). Crescent dunes solar energy project. Wikipedia, https://en.wikipedia.org/w/index.php?title=Crescent_Dunes_Solar_Energy_Project&oldid=1054066143 ↵
- IEA. (n.d.). Evolution of solar PV module cost by data source, 1970-2020 (last updated June 30, 2020). International Energy Agency. https://www.iea.org/data-and-statistics/charts/evolution-of-solar-pv-module-cost-by-data-source-1970-2020 ↵
- Louwen, A., van Sark, W., Faaij, A. et al. (2016). Re-assessment of net energy production and greenhouse gas emissions avoidance after 40 years of photovoltaics development. Nature Communications 7(13728). https://doi.org/10.1038/ncomms13728 ↵
- US Department of Energy. (2019). Approximate wind energy penetration in leading wind markets in 2019, by select country. Statista. https://www.statista.com/statistics/217804/wind-energy-penetration-by-country/ ↵
- Crawford, R. (2009). Life cycle energy and greenhouse gas emissions analysis of wind turbines and the effect of size on energy yield. Renewable and Sustainable Energy Reviews, 13(9), 2653-2660. https://doi.org/10.1016/j.rser.2009.07.008 ↵
- US Energy Information Administration. (2021). Levelized costs of new generation resources in the Annual Energy Outlook 2021. https://www.eia.gov/outlooks/aeo/pdf/electricity_generation.pdf ↵