15.2 Melting Glacial Ice and Permafrost
Steve Earle
Anthropogenic climate change has led to a rapid acceleration in the rate of melting of glacial ice. All around the world glaciers are receding. Valley glaciers are getting shorter, narrower and thinner; in recent decades some of the smaller ones have disappeared completely. Continental glaciers on Greenland and Antarctica are getting thinner.
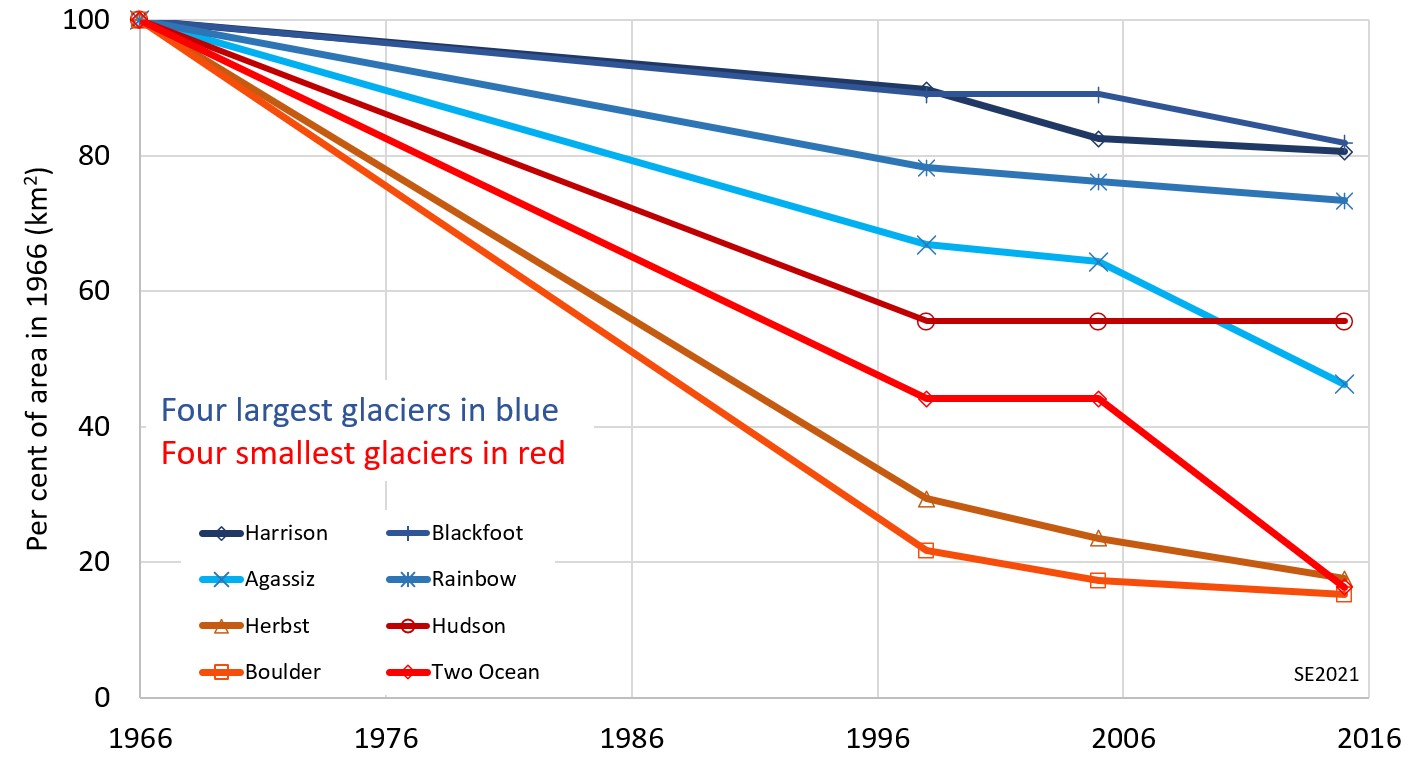
Figure 15.2.1 shows the rate of area loss of 8 of the glaciers in Glacier National Park on the US-Canada border. Over the past 50 years the four largest of the park’s glaciers now have lost 20 to 50% of their area. The smaller glaciers have lost an even greater proportion: 45 to 85%. The 37 named glaciers in the park have lost a total area of 7.2 km2, from 20.8 km2 in 1966, to 13.6 km2 in 2015. And that is only the loss in area; all of these glaciers are now much thinner than they were 50 years ago, so their ice volumes have decreased much more than that.
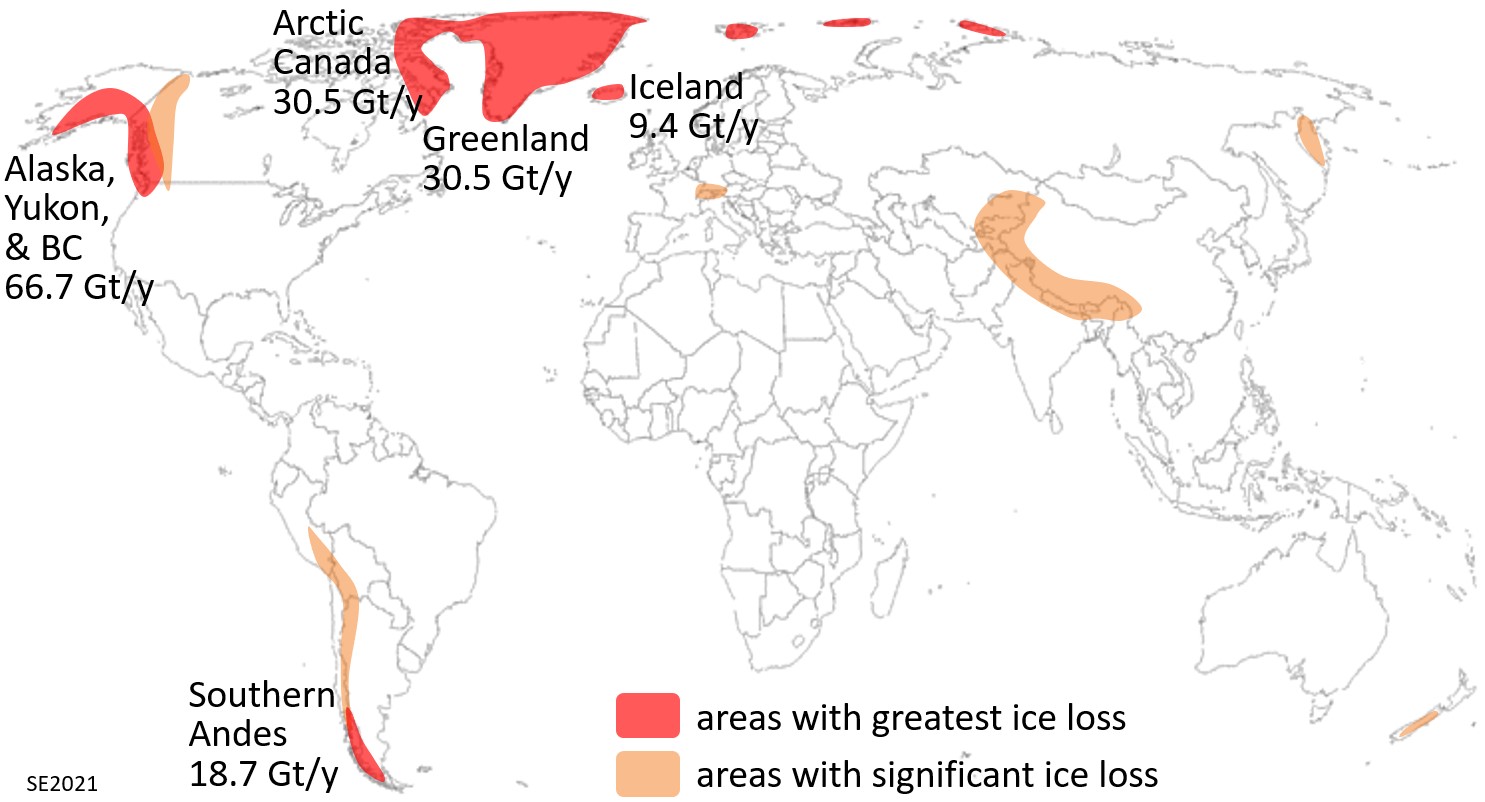
A more recent global study of alpine glaciers and ice-sheet outflow glaciers has shown that their loss of mass is increasing by about 20% per year and that thinning rates have doubled over the past two decades. As shown on Figure 15.2.2, some of the greatest losses are in the area of Alaska, Yukon and British Columbia, while Asian glacier loss rates are amongst the lowest.

Of course, large ice sheets are also melting rapidly. The amount of ice lost from the Greenland Ice Sheet in this century is shown on Figure 15.2.3. The rate has been fairly consistent over that time, and the total volume of ice lost is almost 4,500 km3, or about nine times the volume of Lake Erie (~480 km3). Although that is just a tiny fraction of the volume of Greenland’s ice (about 0.02%), it is still a huge amount of lost ice.
The shrinking and loss of glaciers also represents the loss of some of the splendor of mountainous and polar regions. This is not just the loss of an indulgence for people with the time and resources to travel and/or hike to remote regions (Figure 15.2.4), it is also the loss of inspiration and awe, which are commodities that are much needed in a troubled world.

But as we’ve seen, the loss of glaciers has other more practical implications. Billions of people depend on glacial meltwater for drinking and for agriculture, especially in the dry summers. Berg Glacier, for example, contributes to the flow of the Fraser River, which is a water source for many communities in British Columbia, and also for the important “Fraser Valley” agricultural region east of Vancouver. As glaciers (and snowpacks) lose volume, the summertime flow of rivers like the Fraser will decrease and there will be less of that water available for human needs.
As outlined in Chapter 4, glaciers play a leading role in creating the steep slopes that later become prone to major slope failures, but while they are still around, they play a supporting role in delaying those slope failures. Glacial ice will buttress both the bedrock of a steep U-shaped valley and also the glacial and other sediments that overly it. When a glacier recedes and thins that buttressing will be lost, the exposed rock and sediments will expand in response to the reduced pressure, water will be able to seep into fractures and along bedding planes and freeze-thaw cycles will start working. All of these changes will result in an increased risk of rock falls, rock slides, rock avalanches and debris flows.
Paradoxically, a receding glacier is actually likely to be sliding forward faster than it was when the climate was cold. That’s partly because under warming conditions there is more water flow along the base and also because, in the case of glaciers that end at the ocean or in a lake, there is more calving and melting at the front and the ice is thinner.[1] As the rate of basal sliding increases, the production of sediments also increases, and so the stronger flows of water from the front of glacier will be carrying significantly more sediment than would have been the case under colder conditions. That has implications for stream dynamics and also for aquatic habitat, including fish habitat.
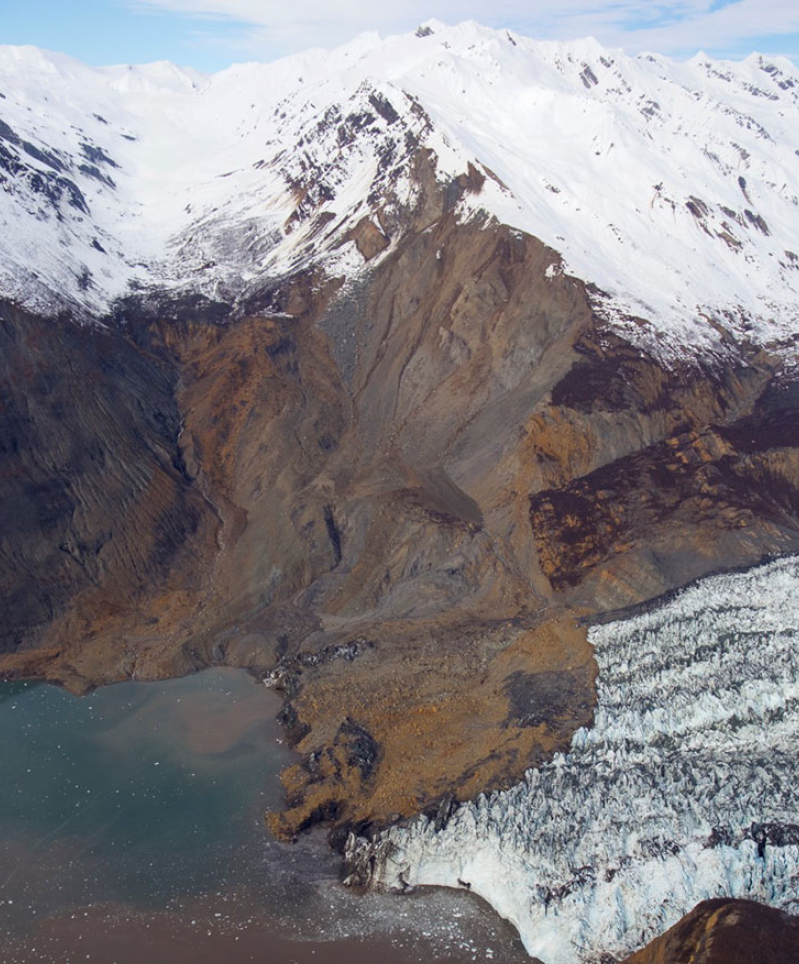
The Tyndall Glacier in Alaska provides an example of both slope failure and changing sedimentation patterns related to glacial retreat. The front of the glacier retreated over 17 km from 1961 to 1991, and then stalled because of a narrow bedrock restriction. In October 2015, a 76 million cubic metre block of rock on the side of the mountain near to the terminus of the glacier failed, becoming a rock avalanche that covered part of the front of the glacier (Figure 15.2.5) and extended into the head of Taan Fjord, producing a 192 m high tsunami. According to Williams and Koppes (2019) the failure is attributed to the loss of buttressing by the Tyndall Glacier and its tributary Daisy Glacier.
The November 2020 Elliot Creek debris flow that is described in Box 5.1 (Section 5.2) occurred in a very similar situation to the 2015 failure at the Tyndall Glacier, and although that failure has yet to be ascribed to debuttressing, there is a likelihood that it played a role there as well.
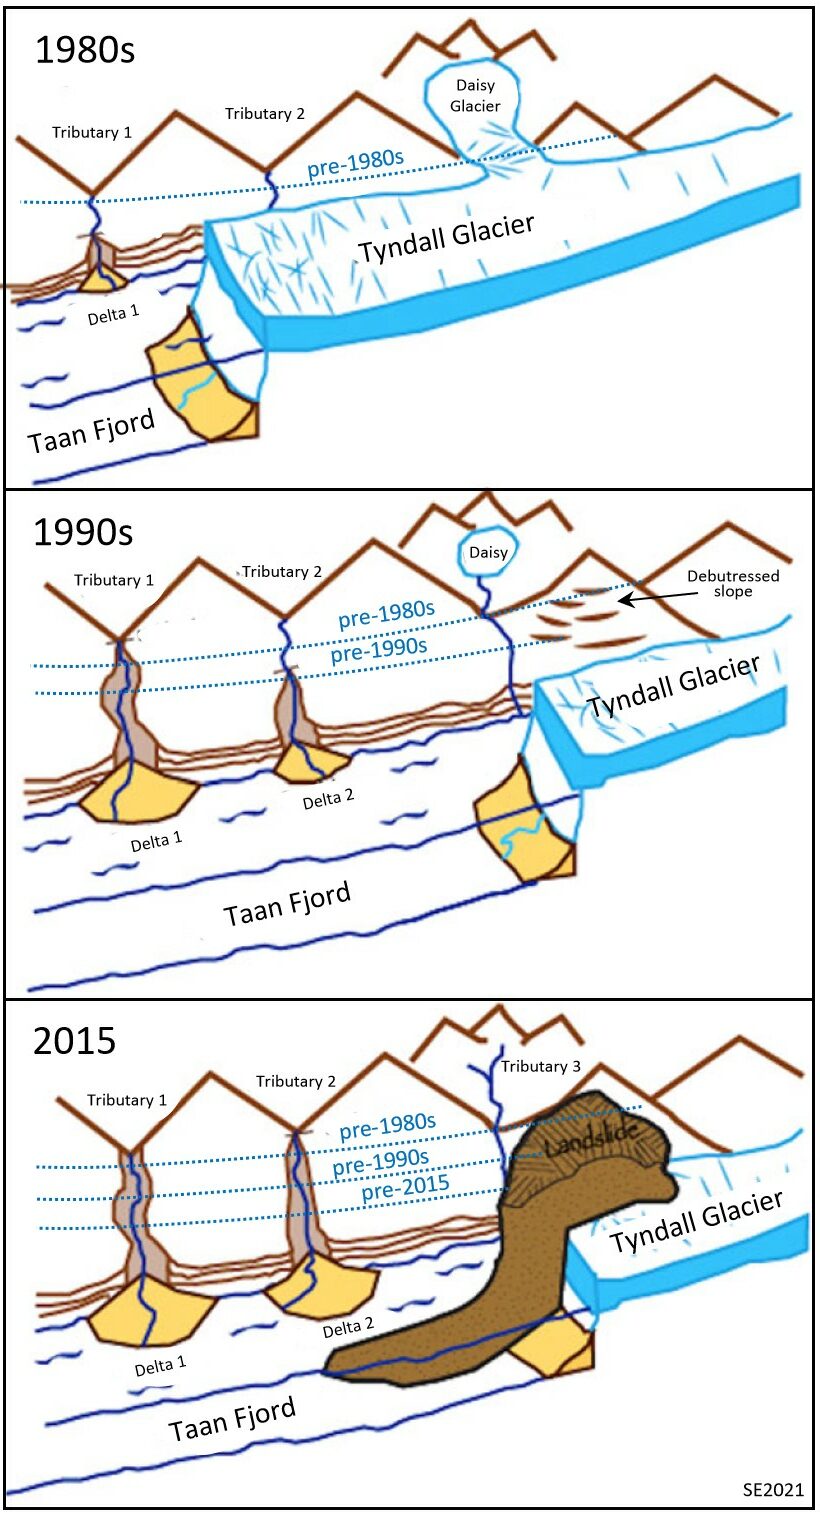
Williams and Koppes (2019) have sketched a scenario showing the how the thinning and retreat of the Tyndall Glacier over the last 35 years has led to debuttressing of the slope which failed in 2015, and also how the retreat of the glacier has changed the relationship between the tributary valleys and the main valley (now the Taan Fjord) leading to increased erosion of the sides of the fjord and accumulation of sediments within the fjord (Figure 15.2.6).
The ongoing strong melting of glaciers in areas with extensive ice sheets—such as northern Canada or Greenland—has the potential to reduce the salinity of ocean water, and, as is described in some detail in Section 3.5, this leads to a reduction in the density of ocean water which can result in changes in the ocean’s thermohaline circulation system. Although the ramifications of such changes could be global, the most immediate effect would be a slowing of the Gulf Stream, which would have significant implications for the climate of western Europe and Iceland.
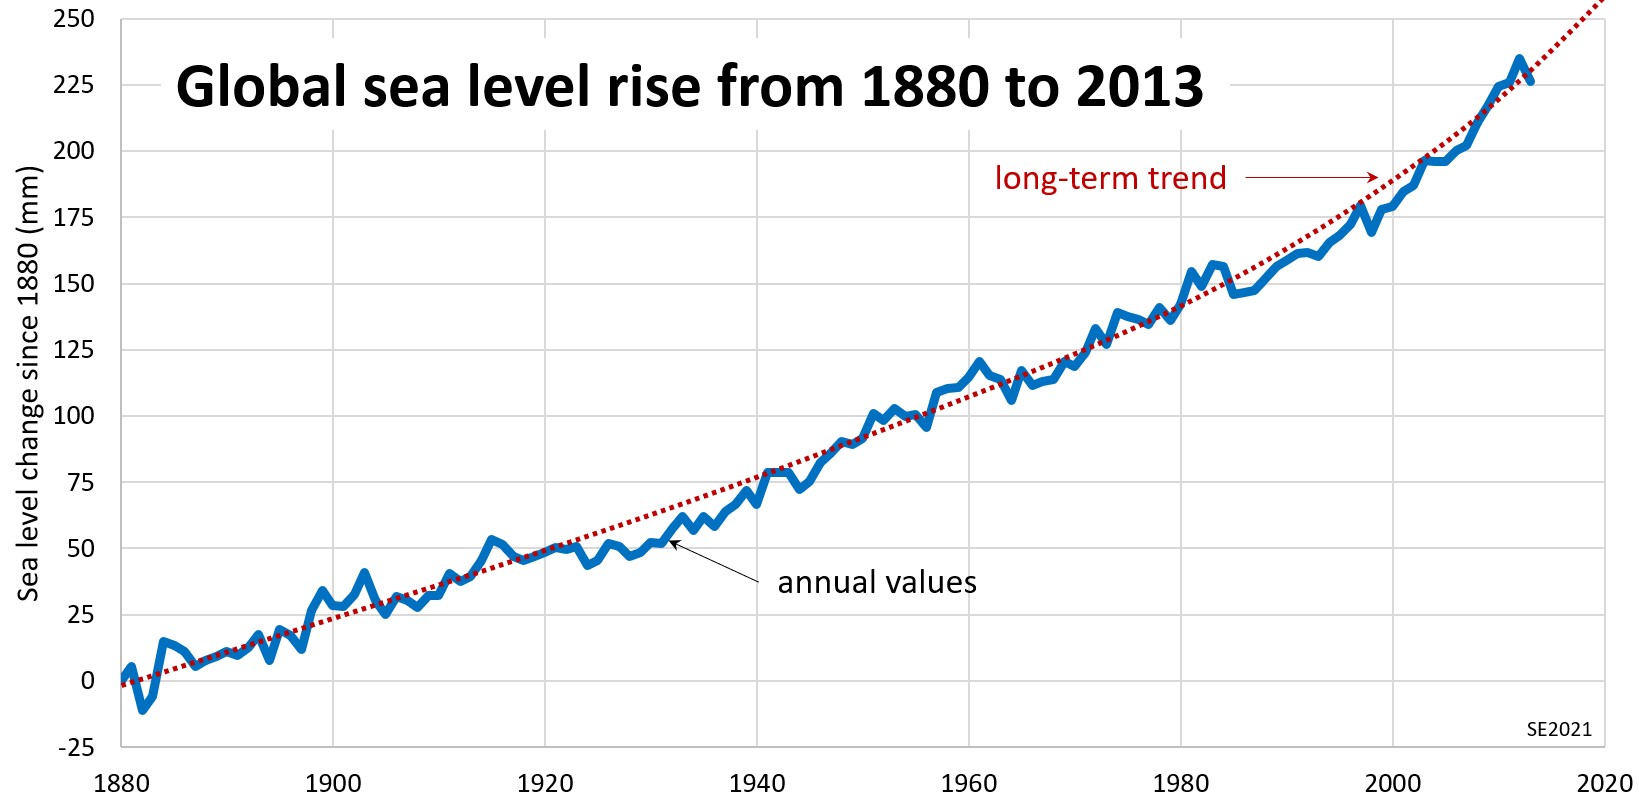
The more obvious effect of melting glacial ice is sea-level rise. A 140-year record of sea-level change is shown on Figure 15.2.7.
During the early part of this period the rate of increase was just over 1 mm/y. By the latter part of the 20th century, it was over 2 mm/y and since 2000 it has been closer to 4 mm/y. Although the total rise in sea level has been relatively small so far (25 cm, or about the height of a bottle of wine) the rate is going to continue to increase, and we will very likely see that much again in the next 30 to 40 years. The total will probably exceed 1 m by the end of this century and some estimates show that it could exceed 2.5 m.[2] Most (about two-thirds) of this rise is related to addition of water from melting glaciers, but some of it is caused by an increase in the temperature of ocean water, which has made it expand.
A metre of sea level rise will have life-changing implications for hundreds of millions of people around the world. A recent study shows that by 2100 over 300 million people will be at risk of at least annual flooding events, if not complete inundation, most of them in China, followed by India, Bangladesh and Vietnam, and then by most other countries in Southeast Asia as well as USA, Egypt, Japan, Netherlands, Great Britain and Brazil.[3] As we’ll see in the next section, the risks associated with a rising sea level are exacerbated by an increase in the number of extreme weather events, especially tropical storms.
But it is not just loss of land to live on that is at risk from sea-level rise, another important issue is the salinization of groundwater resources in coastal areas. As shown on Figure 11.4.6 the groundwater beneath the oceans is salty, and salt water extends under the land area to a depth 40 times greater than the water table extends above sea level. That means that if you drill a well near the coast where the water table is 1 m above sea level, you are likely to encounter salt water at a depth of 40 m below sea level. This is a particular problem in places with flat coastal plains, like parts of China or Bangladesh, or southern Florida, as shown on Figure 11.4.7. As you’ll see, if you complete Exercise 15.2, sea level rise is going to make matters considerably worse in such situations.
Exercise 15.2 Groundwater Salinity and Sea Level Rise
The diagram below depicts an area with a flat coastal plain. The elevation rises a little over 1 m for every 10 km inland, and the water table is similarly flat. Three wells are being used to extract fresh water.
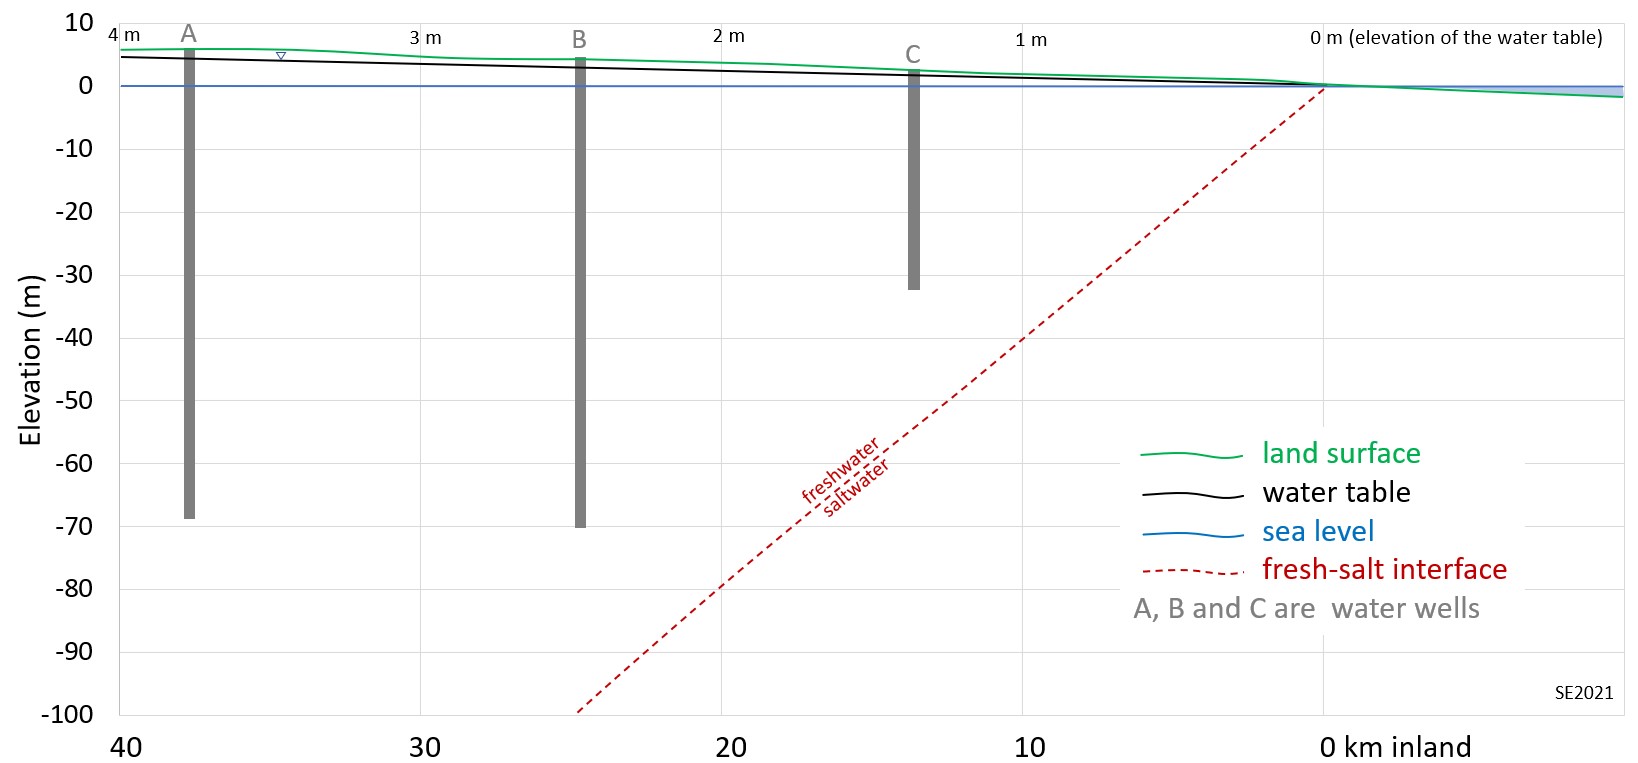
Consider the situation where sea level is now 1 m higher than in what is shown. Assume that the water table remains the same and draw in the new location of the saltwater-freshwater interface.
Which of the wells will no longer provide fresh water?
Exercise answers are provided Appendix 2.
Melting and Destabilization of Permafrost
The Batagaika Crater is a giant gaping hole in the Yakutia region of Siberia. It is 60 m deep with an area equivalent to 111 soccer fields (780,000 m2) and it is growing by the equivalent of about 3 soccer fields a year. It started forming in the 1960s when the trees in the surrounding region were cut. That allowed the permafrost to start thawing, and now there is nothing that can stop it.[4] [5] The permafrost that is collapsing is rich in carbon, and that carbon is being released into the atmosphere in the form of carbon dioxide and methane.
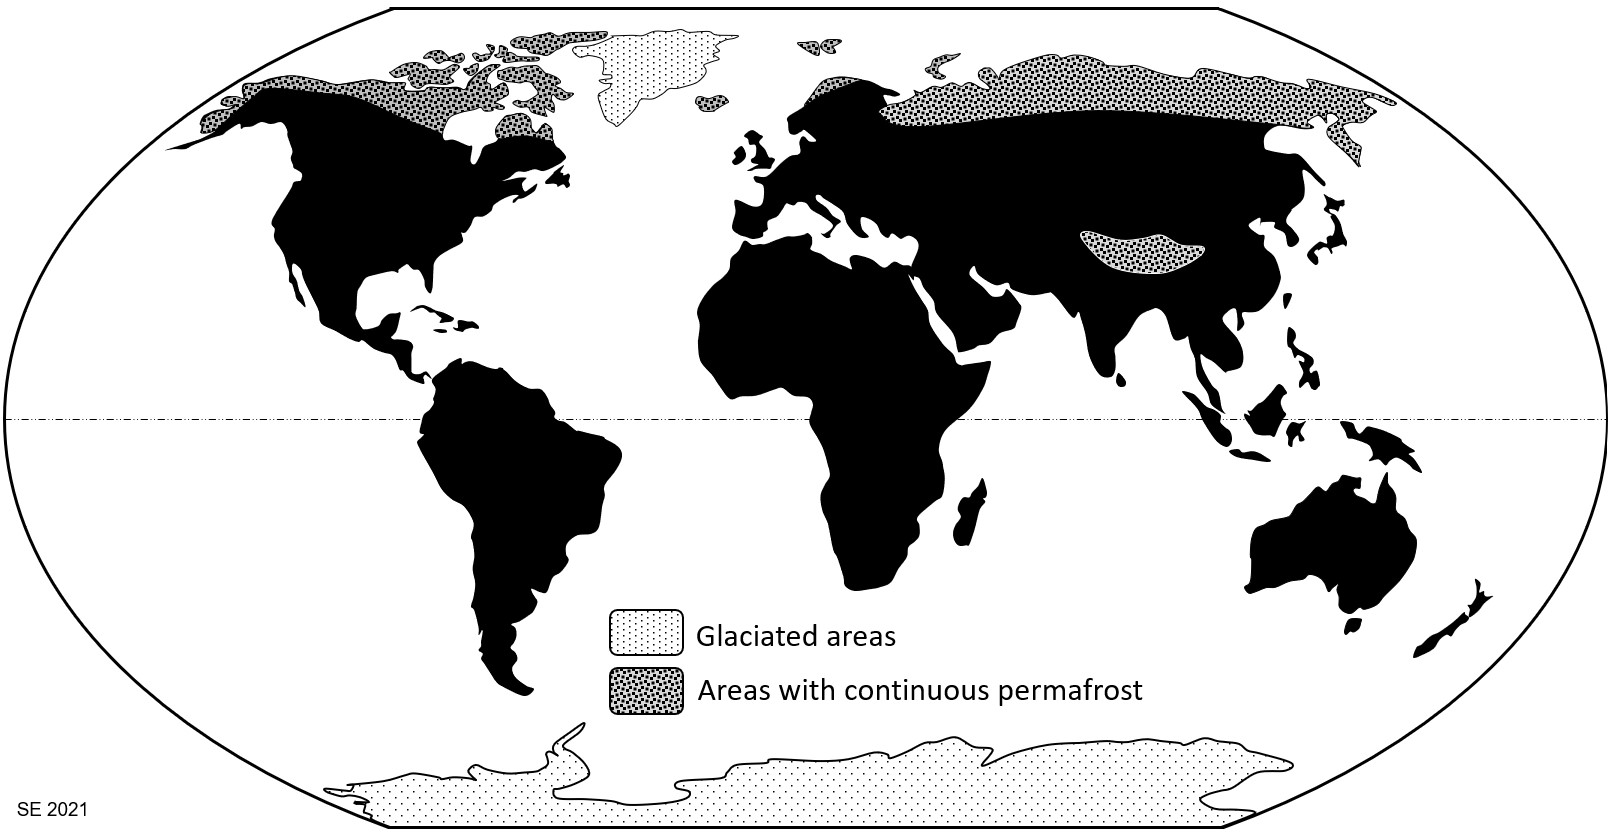
Permanently frozen soil exists in non-glaciated areas at high latitudes or at high elevations where the mean annual temperature is consistently below 0⁰ C (Figure 15.2.8). It is called permafrost if it persists for at least two years, although most permafrost has existed at least since the last deglaciation (about 12,000 years). Permafrost conditions extend across about 25% of the land in the northern hemisphere. The greatest areas are in Arctic regions of Russia, Canada, and Alaska, but there is also extensive permafrost on the Tibetan Plateau and adjacent Himalayan Mountains, and less extensive areas on other mountain ranges in the northern hemisphere and the Andes in South America (not shown).
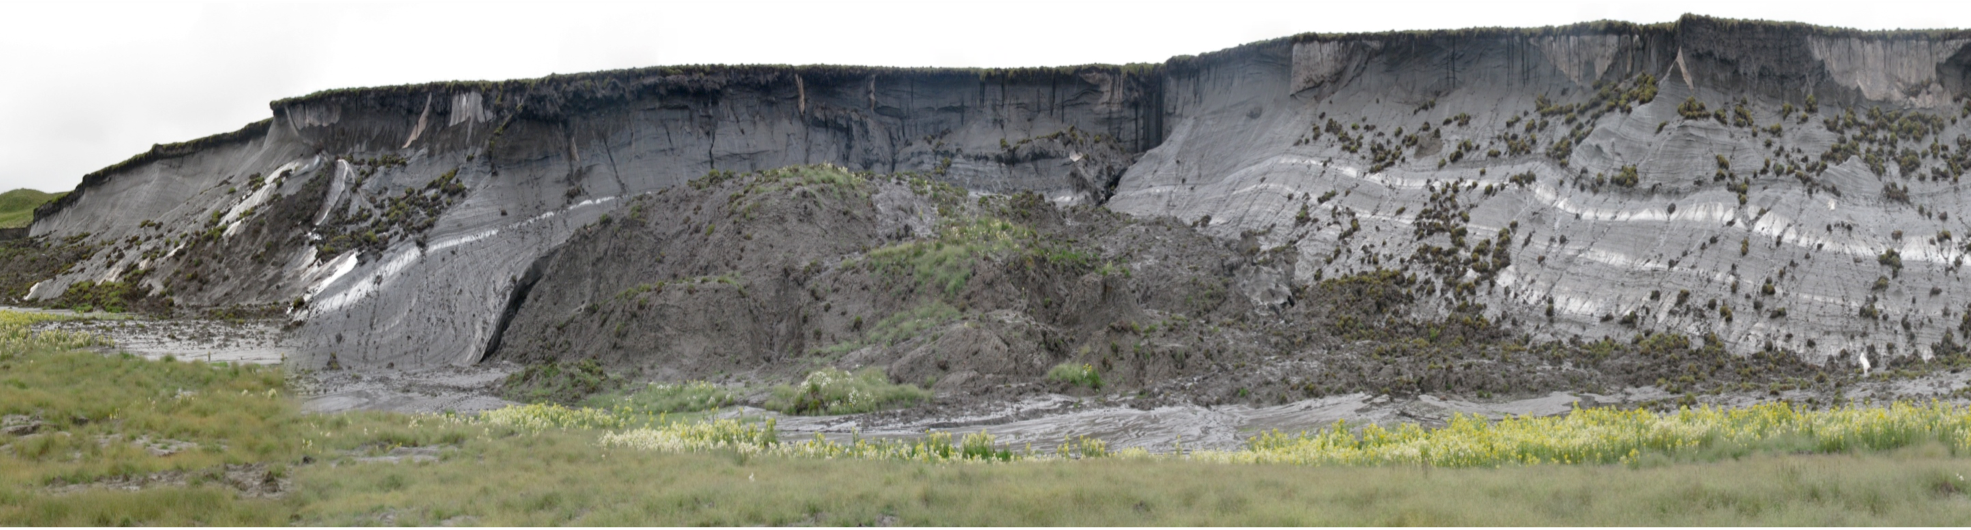
Batagaika Crater is perhaps the most striking example of permafrost collapse and disintegration, but there are thousands of other similar sites around the Arctic where melting of ice is leading to significant slope failure and, in some cases, loss of land. One example, from northern Canada, is shown on Figure 15.2.9. The large mound of material in the middle of the image has collapsed from the embankment behind it as a result of melting of the permafrost.
It has been estimated that the frozen materials that make up permafrost hold twice as much carbon as is currently in the atmosphere,[6] and when these materials thaw and collapse most of that carbon gets released as methane and carbon dioxide. While this process will take centuries, the rate of breakdown is accelerating, and the feedbacks, which include higher GHG levels and a decrease in the albedo of degrading sites (more solar energy is absorbed by the dark surfaces of the degraded permafrost, and so more melting takes place) are strongly positive.
Media Attributions
- Figure 15.2.1 Steven Earle, CC BY 4.0, based on data in: Fagre, D., McKeon, L., Dick, K., and Fountain, A. (2017). Glacier margin time series (1966, 1998, 2005, 2015) of the named glaciers of Glacier National Park, MT, USA: U.S. Geological Survey data release. https://dx.doi.org/10.5066/F7P26WB1
- Figure 15.2.2 Steven Earle, CC BY 4.0, based on information in: Hugonnet, R., et al. (2021). Accelerated global glacier mass loss in the early twenty-first century. Nature, 592, 726–73. https://doi.org/10.1038/s41586-021-03436-z
- Figure 15.2.3 Steven Earle, CC BY 4.0, based on public domain data in: Moon, T. et al., (2020). Greenland Ice Sheet. Arctic Report Card: Update for 2020. National Oceanic and Atmospheric Administration (NOAA). https://arctic.noaa.gov/Report-Card/Report-Card-2020/ArtMID/7975/ArticleID/901/Greenland-Ice-Sheet
- Figure 15.2.4 Photo by Heather Earle, 2015, CC BY 4.0
- Figure 15.2.5 Photo by Williams and Koppes (2019), CC BY 4.0
- Figure 15.2.6 Steven Earle, CC BY 4.0, after Williams and Koppes (2019)
- Figure 15.2.7 Steven Earle, CC BY 4.0, based on public domain data from Global Average Absolute Sea Level Change, 1880-2014, US Environmental Protection Agency using data from CSIRO, 2015; NOAA, 2015 (accessed April, 2021). https://datahub.io/core/sea-level-rise#resource-epa-sea-level
- Figure 15.2.8 Steven Earle, CC BY 4.0
- Figure 15.2.9 Massive Ice-Retrogressive Thaw Slump – cropped – by Dave Fox, 2010, CC BY SA 4.0, via Wikimedia Commons, https://commons.wikimedia.org/wiki/File:Massive_ice_-_retrogressive_thaw_slump_-_Herschel_Island.png
- Williams H. & Koppes M. (2019). A comparison of glacial and paraglacial denudation responses to rapid glacial retreat. Annals of Glaciology 60(80), 151–164. https://doi.org/10.1017/aog.2020.1 ↵
- Sweet, W. et al. (2017). Global and Regional Sea Level Rise Scenarios for the United States. NOAA Tech. Rep. NOS CO-OPS 083. National Oceanic and Atmospheric Administration, National Ocean Service. ↵
- Kulp, S. & Strauss, B. (2019). New elevation data triple estimates of global vulnerability to sea-level rise and coastal flooding. Nature Communications, 10(1), 4844. https://doi.org/10.1038/s41467-019-12808-z ↵
- Murton, J. et al. (2017). Preliminary paleoenvironmental analysis of permafrost deposits at Batagaika megaslump, Yana Uplands, northeast Siberia. Quaternary Research, 87(2), 314-330. doi:10.1017/qua.2016.15 ↵
- Vadakkedath, V., Zawadzki, J. & Przeździecki, K. (2020). Multisensory satellite observations of the expansion of the Batagaika crater and succession of vegetation in its interior from 1991 to 2018. Environmental Earth Sciences, 79(150), https://doi.org/10.1007/s12665-020-8895-7 ↵
- Turetsky, M. et al. (2019). Permafrost collapse is accelerating carbon release. Nature, 569(7754), 32–34. https://doi.org/10.1038/d41586-019-01313-4 ↵